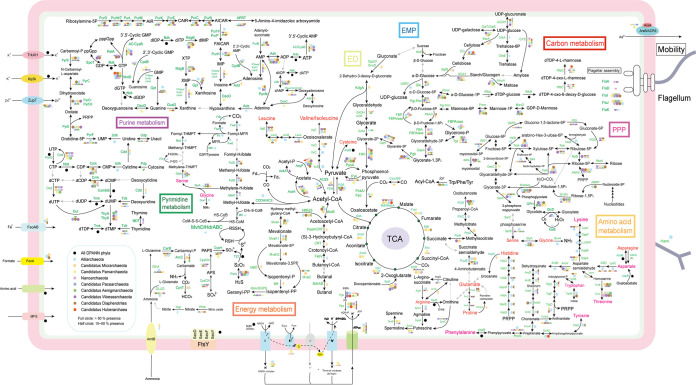
FIG 5.
Metabolic reconstruction of major metabolic pathways in DPANN archaea. Annotation was performed with eggNOG-mapper v. 2.0 (default parameters: E value < 10−3, bit score > 60). Each phylum of DPANN is depicted as a colored circle. Black arrows indicate that the corresponding proteins were detected for the pathways, whereas gray arrows indicate that the corresponding proteins were not detected. Full circles represent over 50% presence, while half circles represent 15 to 50% presence. Detailed distribution data are provided in Table S6 at https://doi.org/10.6084/m9.figshare.14806212.v1. Detailed description for abbreviations is provided in Data S1 at https://doi.org/10.6084/m9.figshare.14806173.v1.

