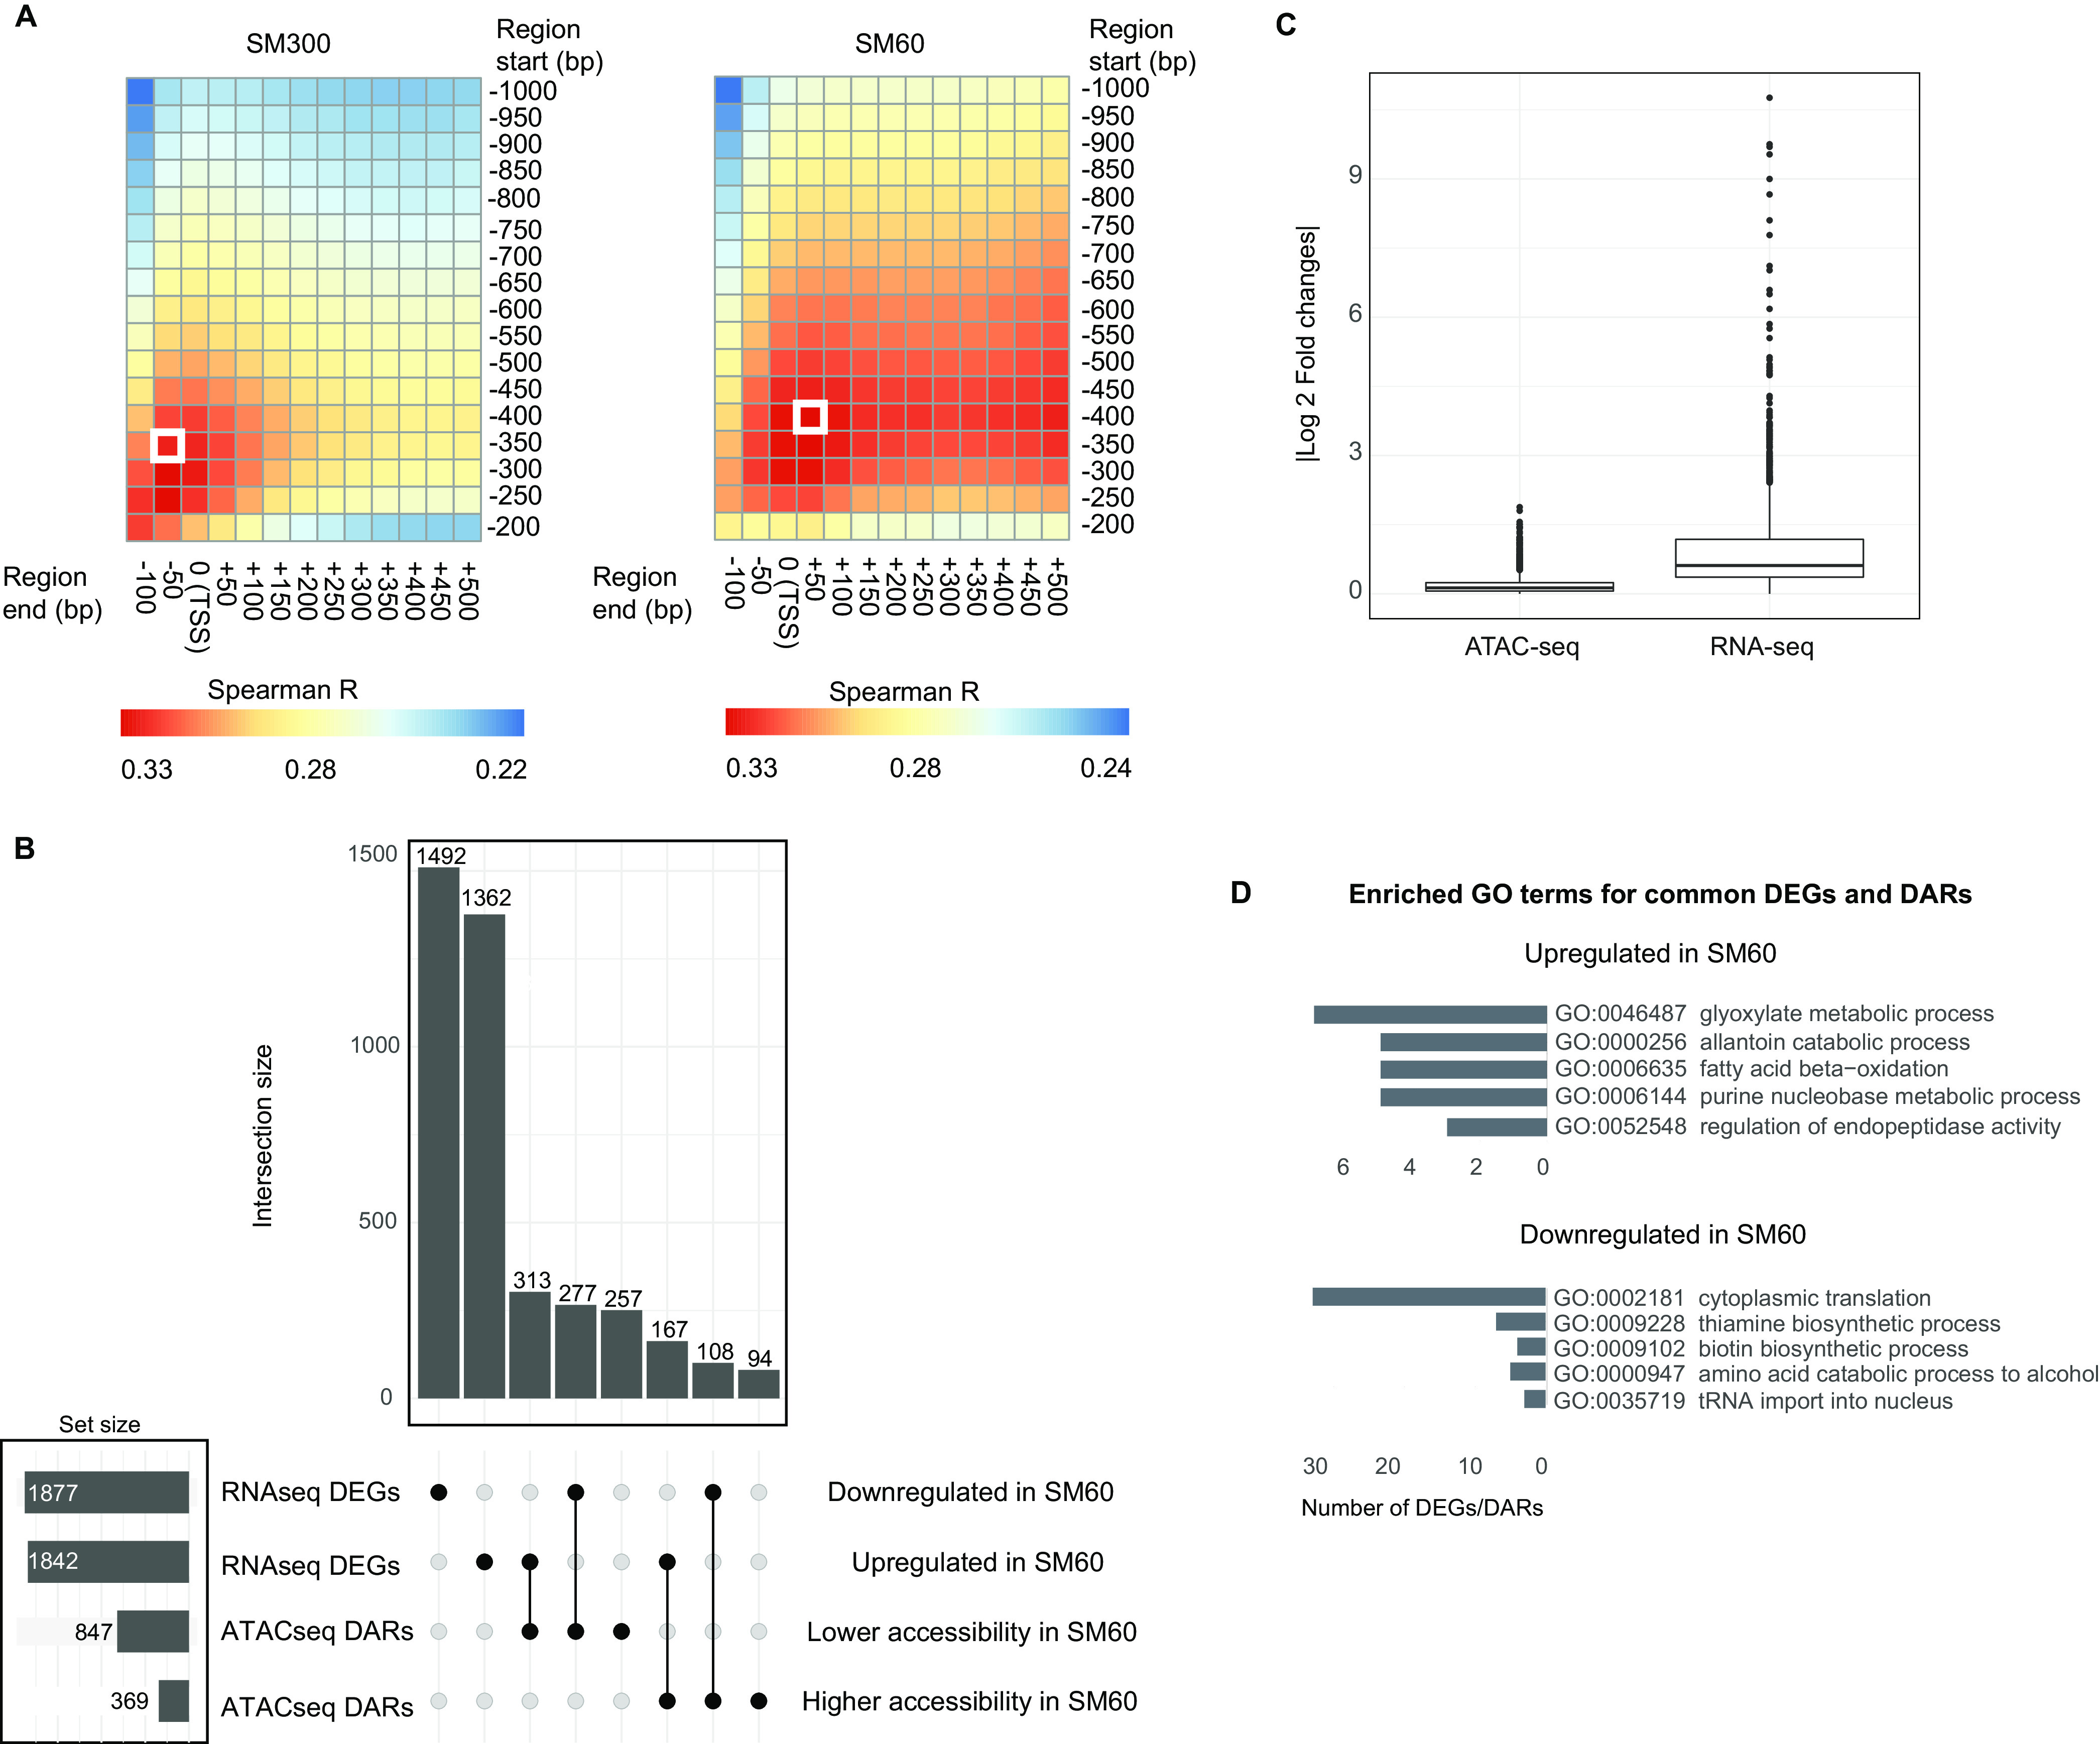
FIG 3.

Hybrid transcriptome and regulatory region accessibility in response to fermentation in low nitrogen wine must. (A) The heatmaps show the Pearson correlation between ATAC-seq coverage and total gene expression of the WE × NA hybrid after 14 h of fermentation in SM300 and SM60. For each gene, different regulatory region segments were evaluated using a sliding window approach starting from 1,000 bp upstream of the transcription start site (TSS) to 200 bp upstream of the TSS, and ending from 100 bp upstream of the TSS to 500 bp downstream of the TSS. The white boxes indicate the regions with the highest correlation in SM300 and SM60. (B) Upset plot showing the number of differentially expressed genes (DEGs) and differentially accessible regions (DARs), the set sizes, and the intersect among combinations. (C) Average absolute log2 fold change of the ATAC-seq and RNA-seq data sets. (D) Number of genes occurring in gene ontology (GO) terms (biological processes) enriched among common DEGs and DARs.
