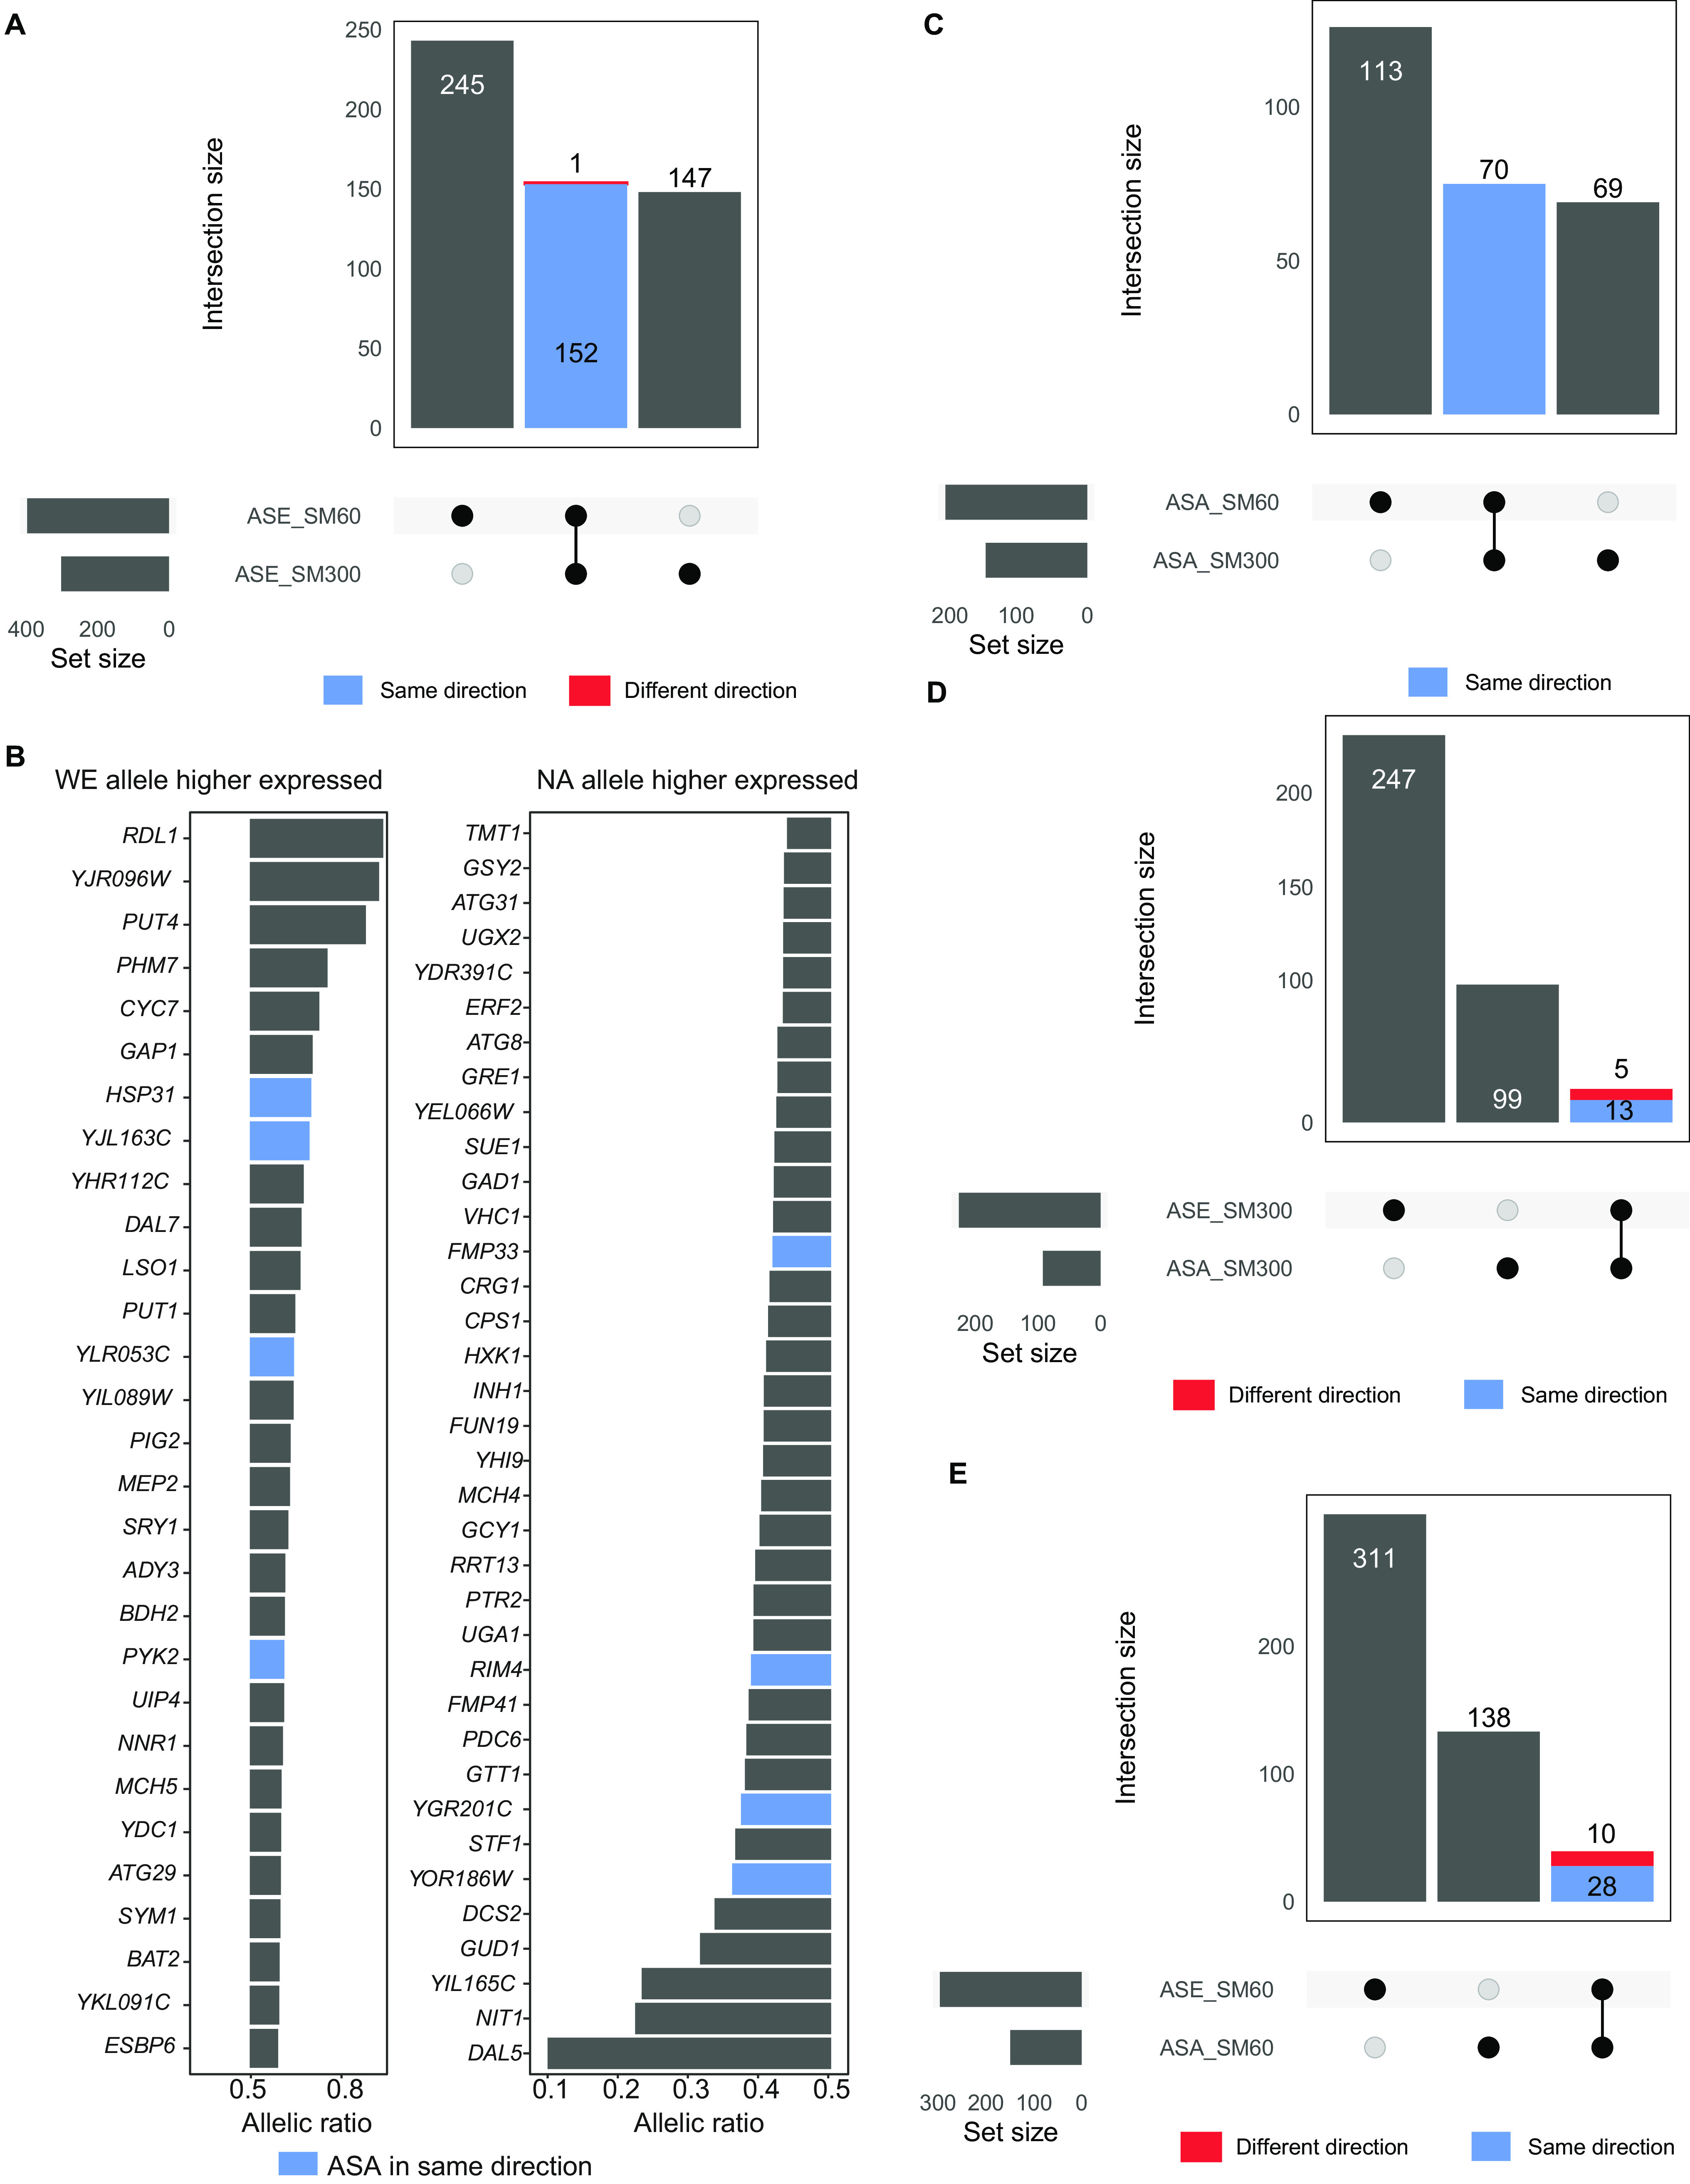
FIG 4.

Allelic imbalance in accessibility and gene expression in the WE × NA hybrid. (A) Upset plot showing the number of genes in differential allelic imbalance under SM300 and SM60 in the WE × NA hybrid and the intersection between conditions. Blue bars indicate that allelic ratios were maintained between conditions, while red bars indicate that allelic ratios were inverse between conditions. (B) The bar plots show the expression ratio of genes with significant ASE and induced by SM60 (FDR < 0.05, log2 fold change > 3). Genes with allelic ratios higher than 0.5 had higher expression of the WE allele, while genes with allelic ratios lower than 0.5 had higher expression of the NA allele. Blue bars indicate genes that also showed differential ASA in the same direction of ASE, i.e., bias favoring the same genotype in accessibility and expression. (C) Upset plot showing the numbers of regulatory regions in differential ASA in SM300 and SM60 and the intersection across conditions. (D and E) The upset plot shows the number of differential ASE and ASA in SM300 (D) and SM60 (E), and the intersection of these within the same condition.
