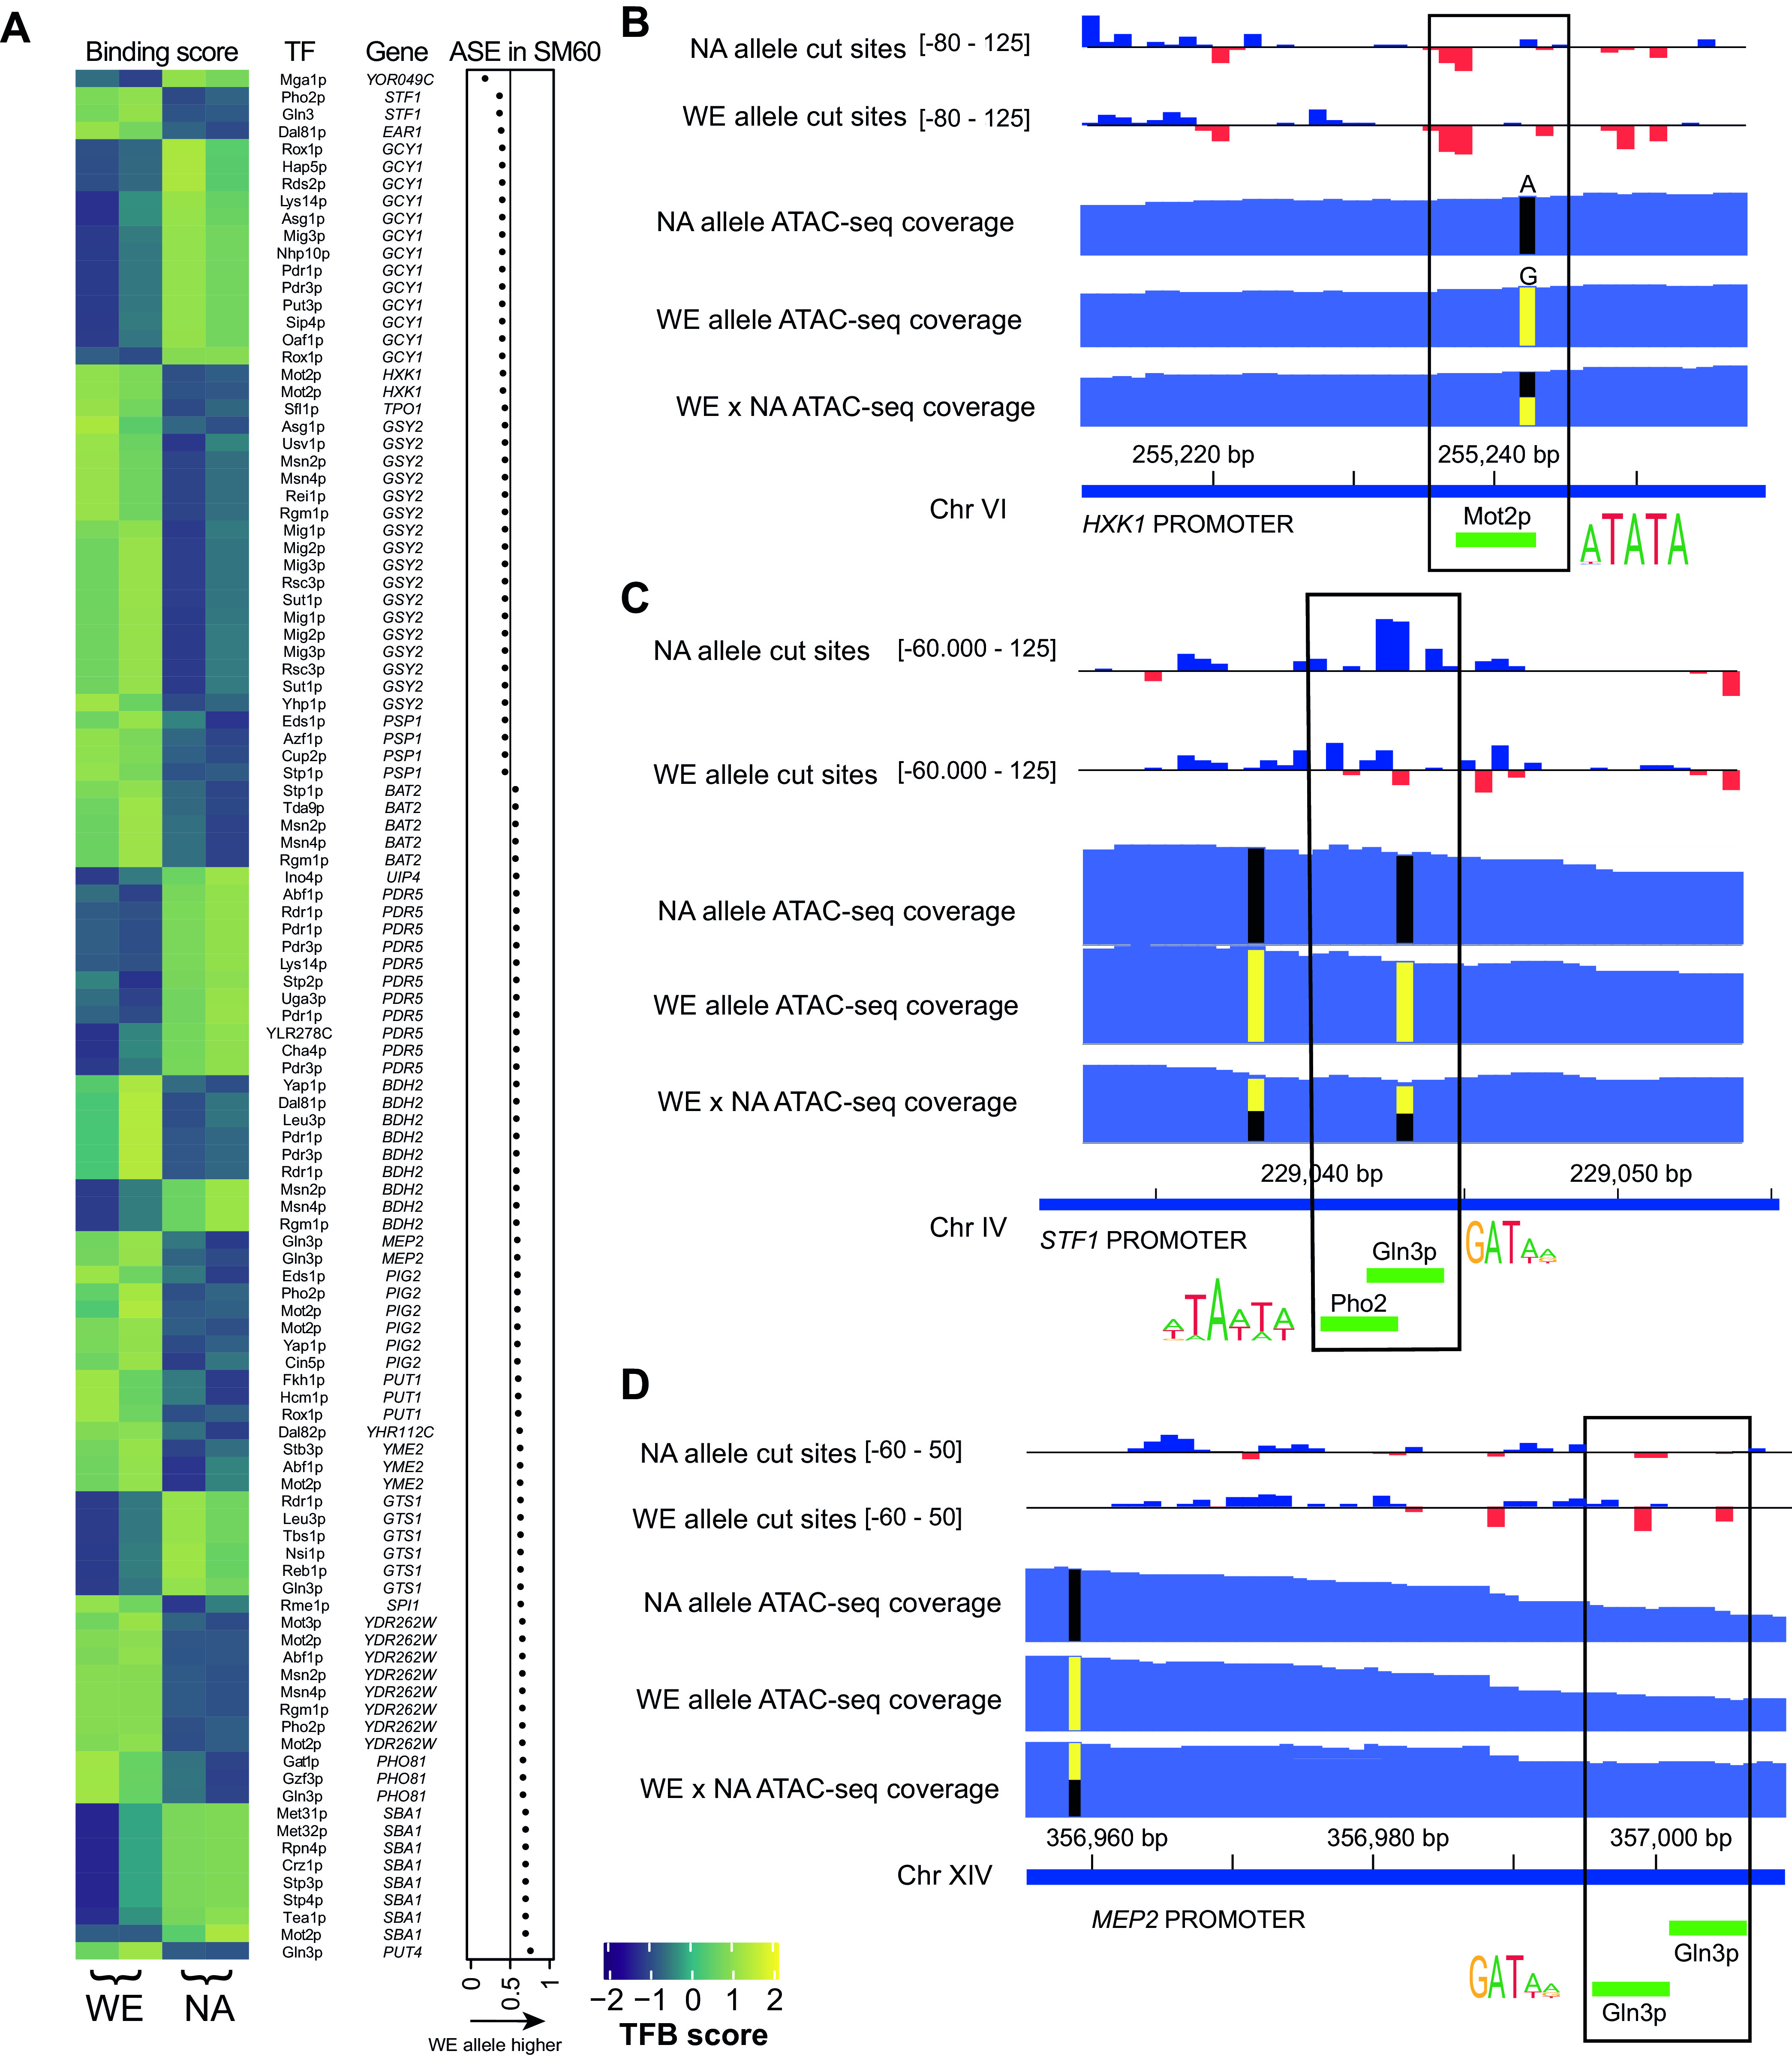
FIG 6.

ASB in genes induced under low nitrogen and showing ASE. (A) Heatmap depicting the allele-specific binding scores of 61 TFs bound to 23 regulatory regions of genes induced by low nitrogen. These genes showed allelic imbalance in gene expression (dot plot) but no allelic differences in accessibility. TFB scores are shown as z-score. (B to D) Three examples of allelic imbalance in TFB explaining ASE. The bar plot shows the bias-corrected Tn5 cut site signal obtained as reported by TOBIAS. Negative values (red bars) surrounded by positive values (blue bars) suggest the presence of a transcription factor binding footprint. The range of values for each bar plot is indicated. ATAC-seq coverage demonstrates similar accessibility in both parental backgrounds. Allele-specific data (cut sites and coverage) were obtained after splitting SNP-informative reads from the hybrid ATAC-seq alignments. Green bars show the location of predicted motifs found at differentially bound regions. Logos show the consensus motifs.
