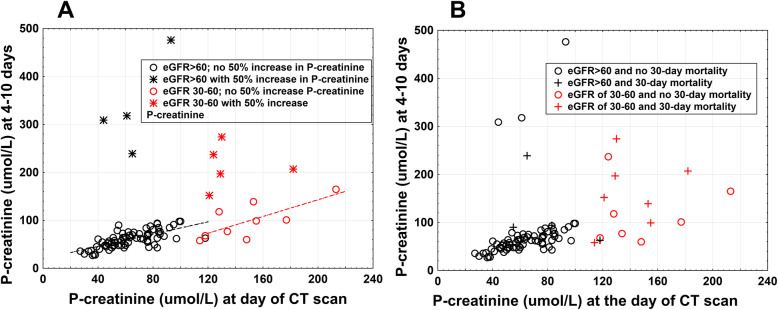
Fig. 2.
Outcomes, based on eGFR, in patients hospitalized with Covid-19 that underwent contrast-enhanced CT. P-creatinine values (μmol/L) at the time of CT are plotted relative to P-creatinine values at 4–10 days after CT. Patients with renal replacement therapy at the time of CT were excluded. (a) eGFR and a contrast-enhanced induced rise in P-creatinine. Black unfilled circles or stars represent patients with an eGFR> 60 ml/min/1.73 m2 at CT (n = 79). Black stars indicate patients with a > 50% rise in P-creatinine at 4–10 days (n = 4). Black unfilled circles represent patients without a > 50% rise in P-creatinine or renal replacement therapy initiation (n = 75). The dashed black line shows the correlation between P-creatinine at CT and P-creatinine at 4–10 days; (r = 0.71, p < 0.001). Red unfilled circles or stars represent patients with an eGFR of 30–60 ml/min/1.73 m2 (n = 14). Red stars indicate patients with a > 50% rise in P-creatinine or an renal replacement therapy initiation (n = 5). Red unfilled circles represent patients without a > 50% rise in P-creatinine or an renal replacement therapy initiation (n = 9). The dashed red line shows the correlation between P-creatinine at CT and P-creatinine at 4–10 days (r = 0.74, p = 0.024). (b) eGFR and 30-day mortality. Black unfilled circles and crosses represent patients with an eGFR> 60 ml/min/ 1.73 m2. Black unfilled circles represent patients that did not die within 30 days after CT. Black crosses represent patients that died within 30 days after the CT. Red unfilled circles and crosses represent patients with an eGFR of 30–60 ml/min/1.73 m2. Red unfilled circles represent patients that did not die within 30 days of the CT. Red crosses represent patients that died within 30 days after the CT. CT: computed tomography; eGFR: estimated glomerular filtration rate; P-creatinine: plasma creatinine

