
Figure 2.
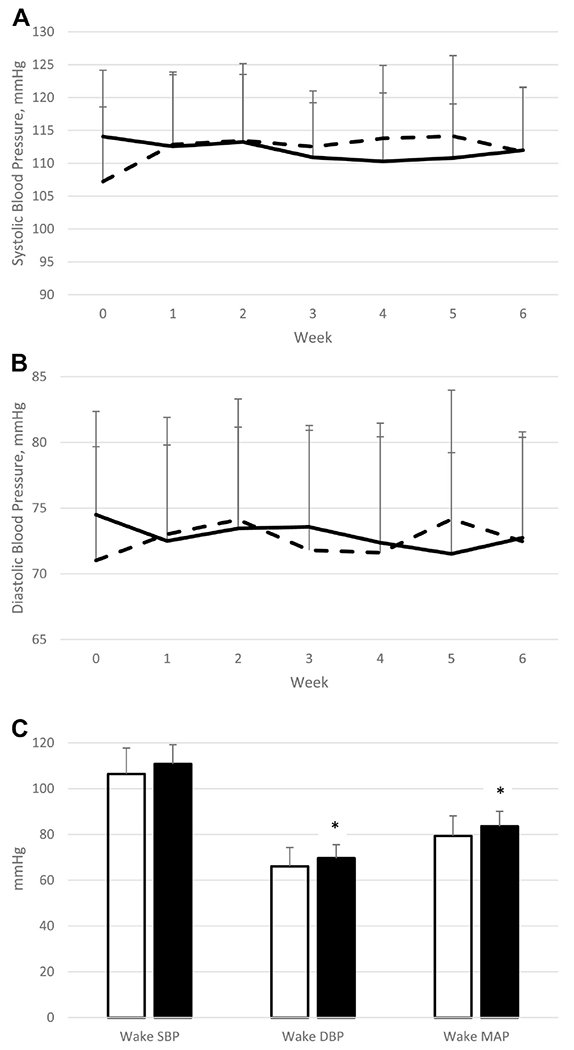
Weekly SBP (panel A) and DBP (panel B) during the 6-wk intervention periods (HS, solid line, and SR, hatched line). Data are unadjusted raw means±SD; n=24. There is a significant sleep x week interaction on SBP (P=0.0048) and trend for main effect of sleep (P=0.061). Twenty-four-hour wake SBP, DBP, and mean arterial pressure after 6 wk of HS (white bars) and SR (black bars) is shown in panel C. Data are unadjusted raw means±SD; n=17 for HS and 14 for SR. * Significantly higher than HS, P<0.05.