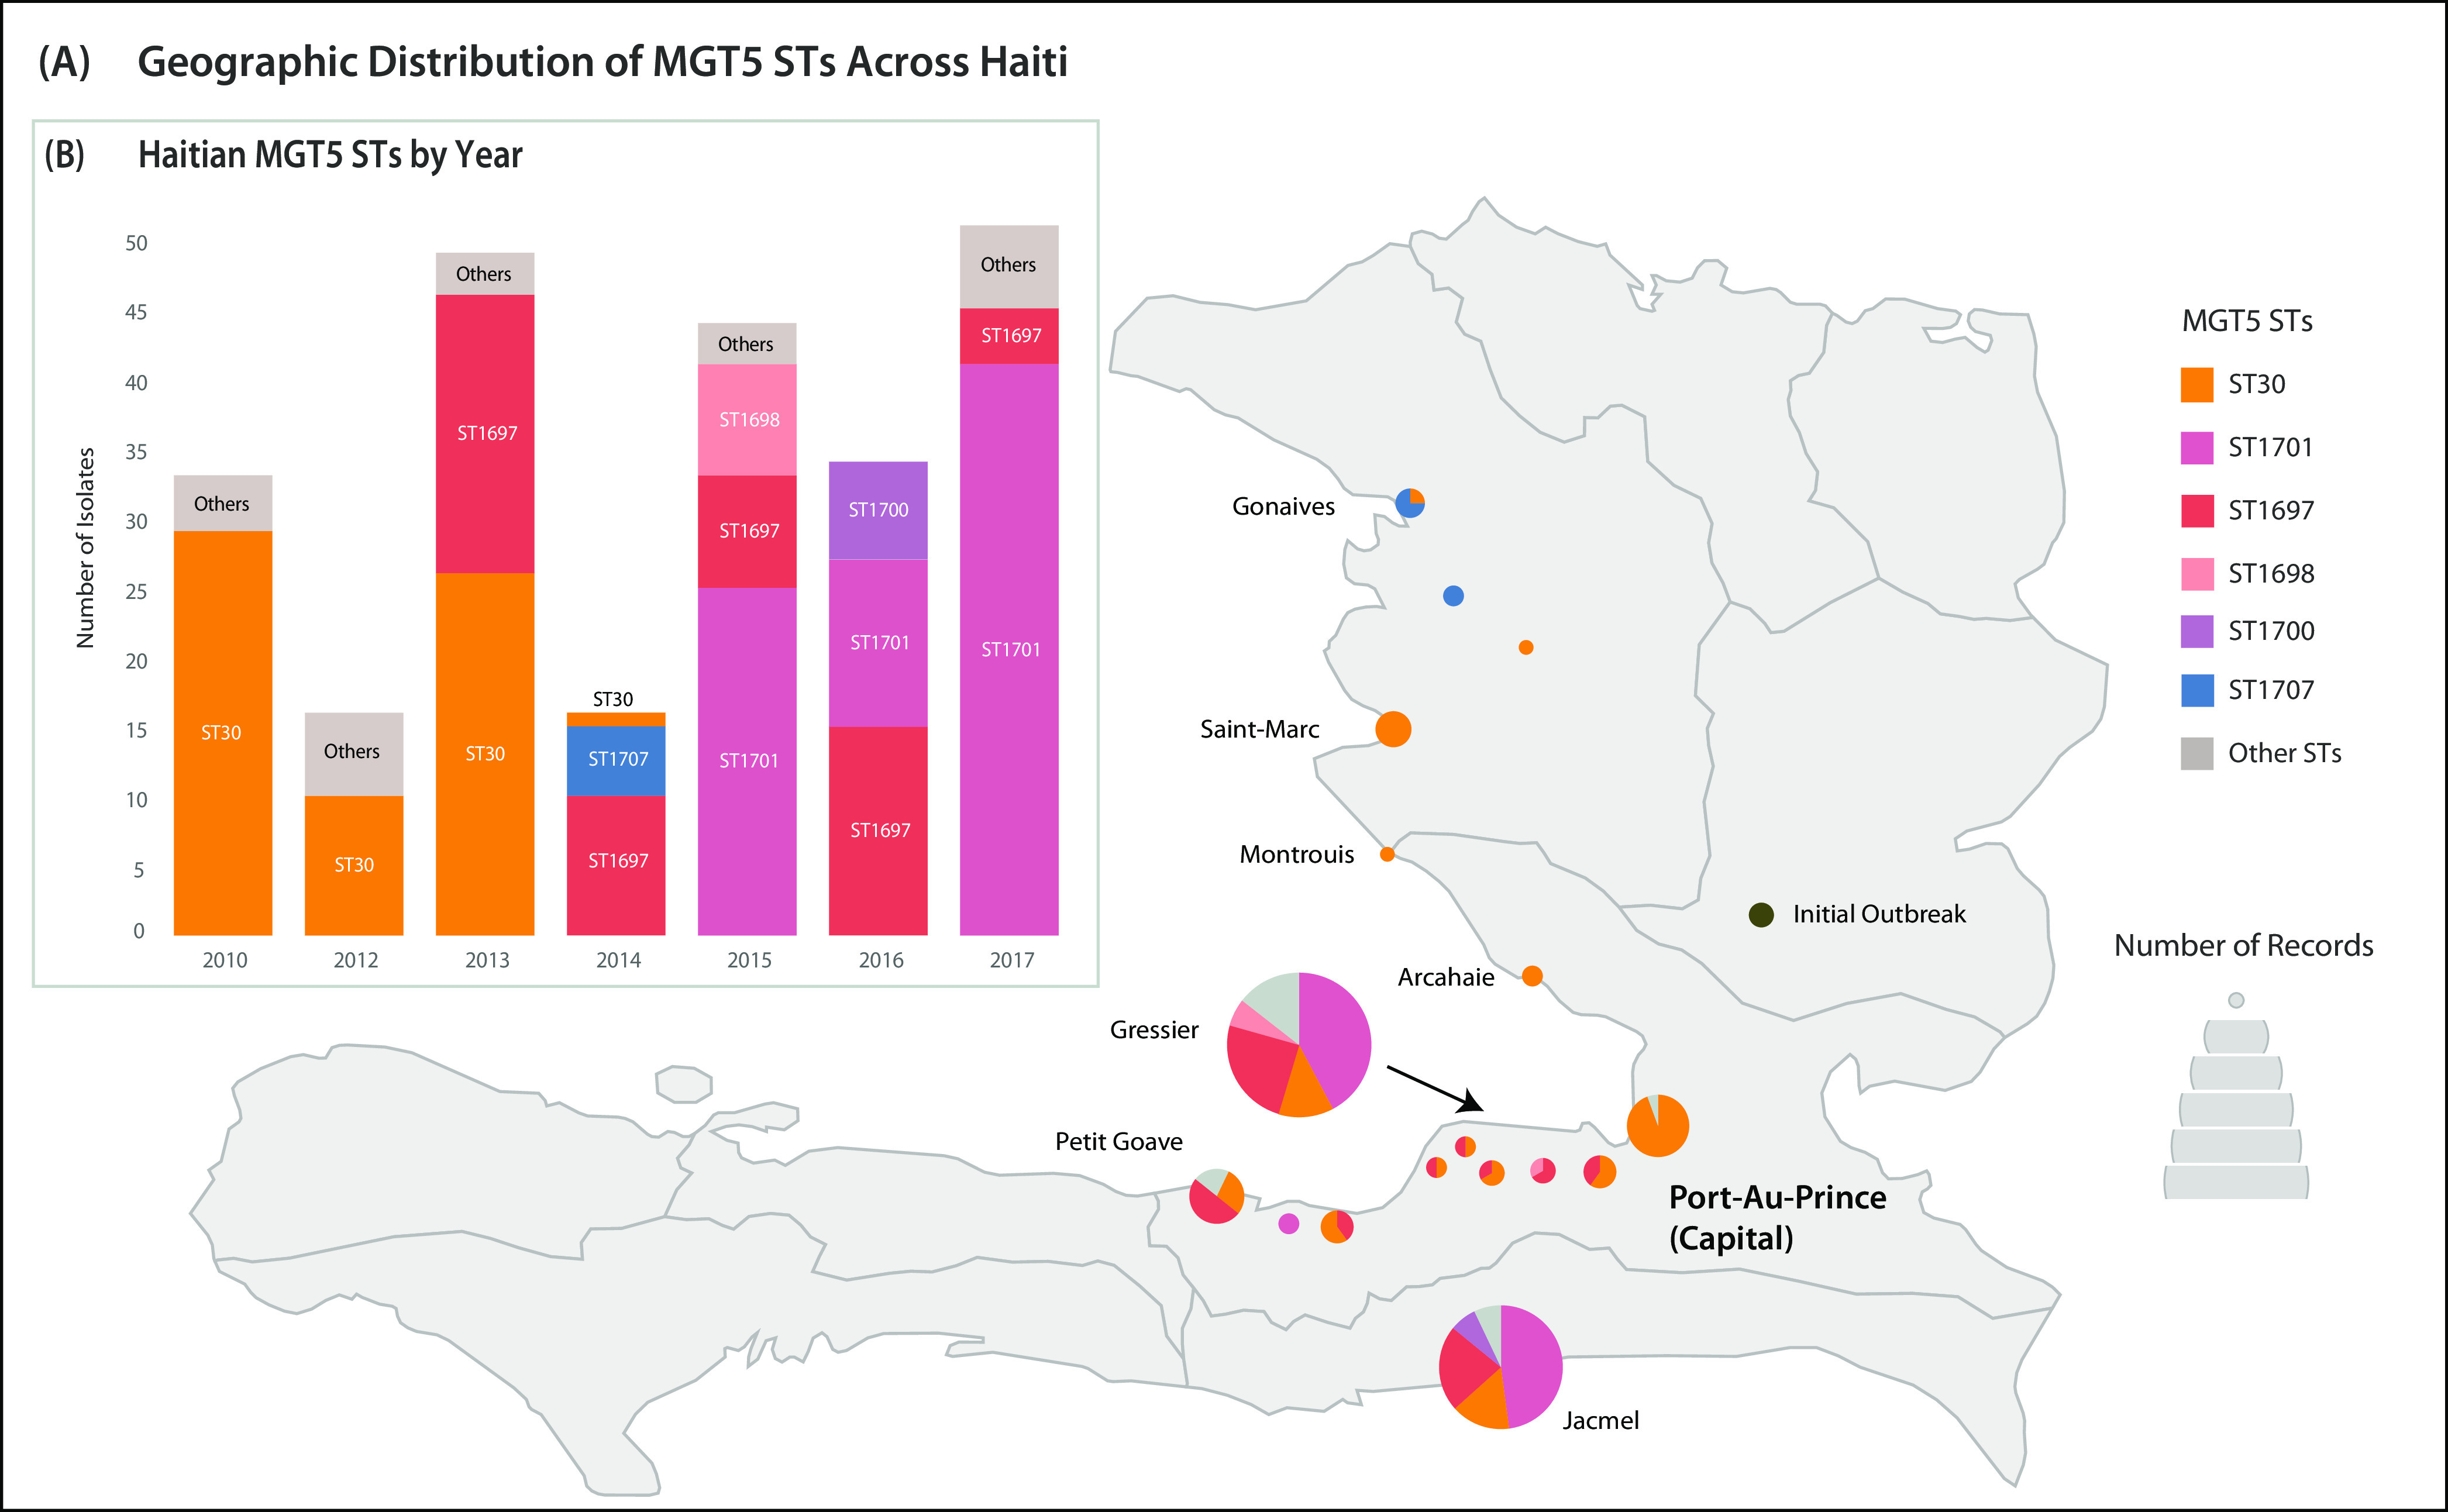
FIG 5.

Geographic and temporal distribution of Haitian MGT5 STs. Isolates were collected between 2010 and 2017 from 11 locations. Coloring of STs between the bar chart and map is consistent. (A) The sizes of bubbles on the map are proportional to the numbers of isolates. Bubbles are divided based on MGT5 STs related to that location. The map was sourced from simplemaps (available at https://simplemaps.com/resources/svg-ht). (B) For each year, the number of isolates assigned to each MGT5 ST is shown. STs assigned to fewer than 10 isolates are collapsed into a single gray box. Visualized with Tableau v9.1 (41).
