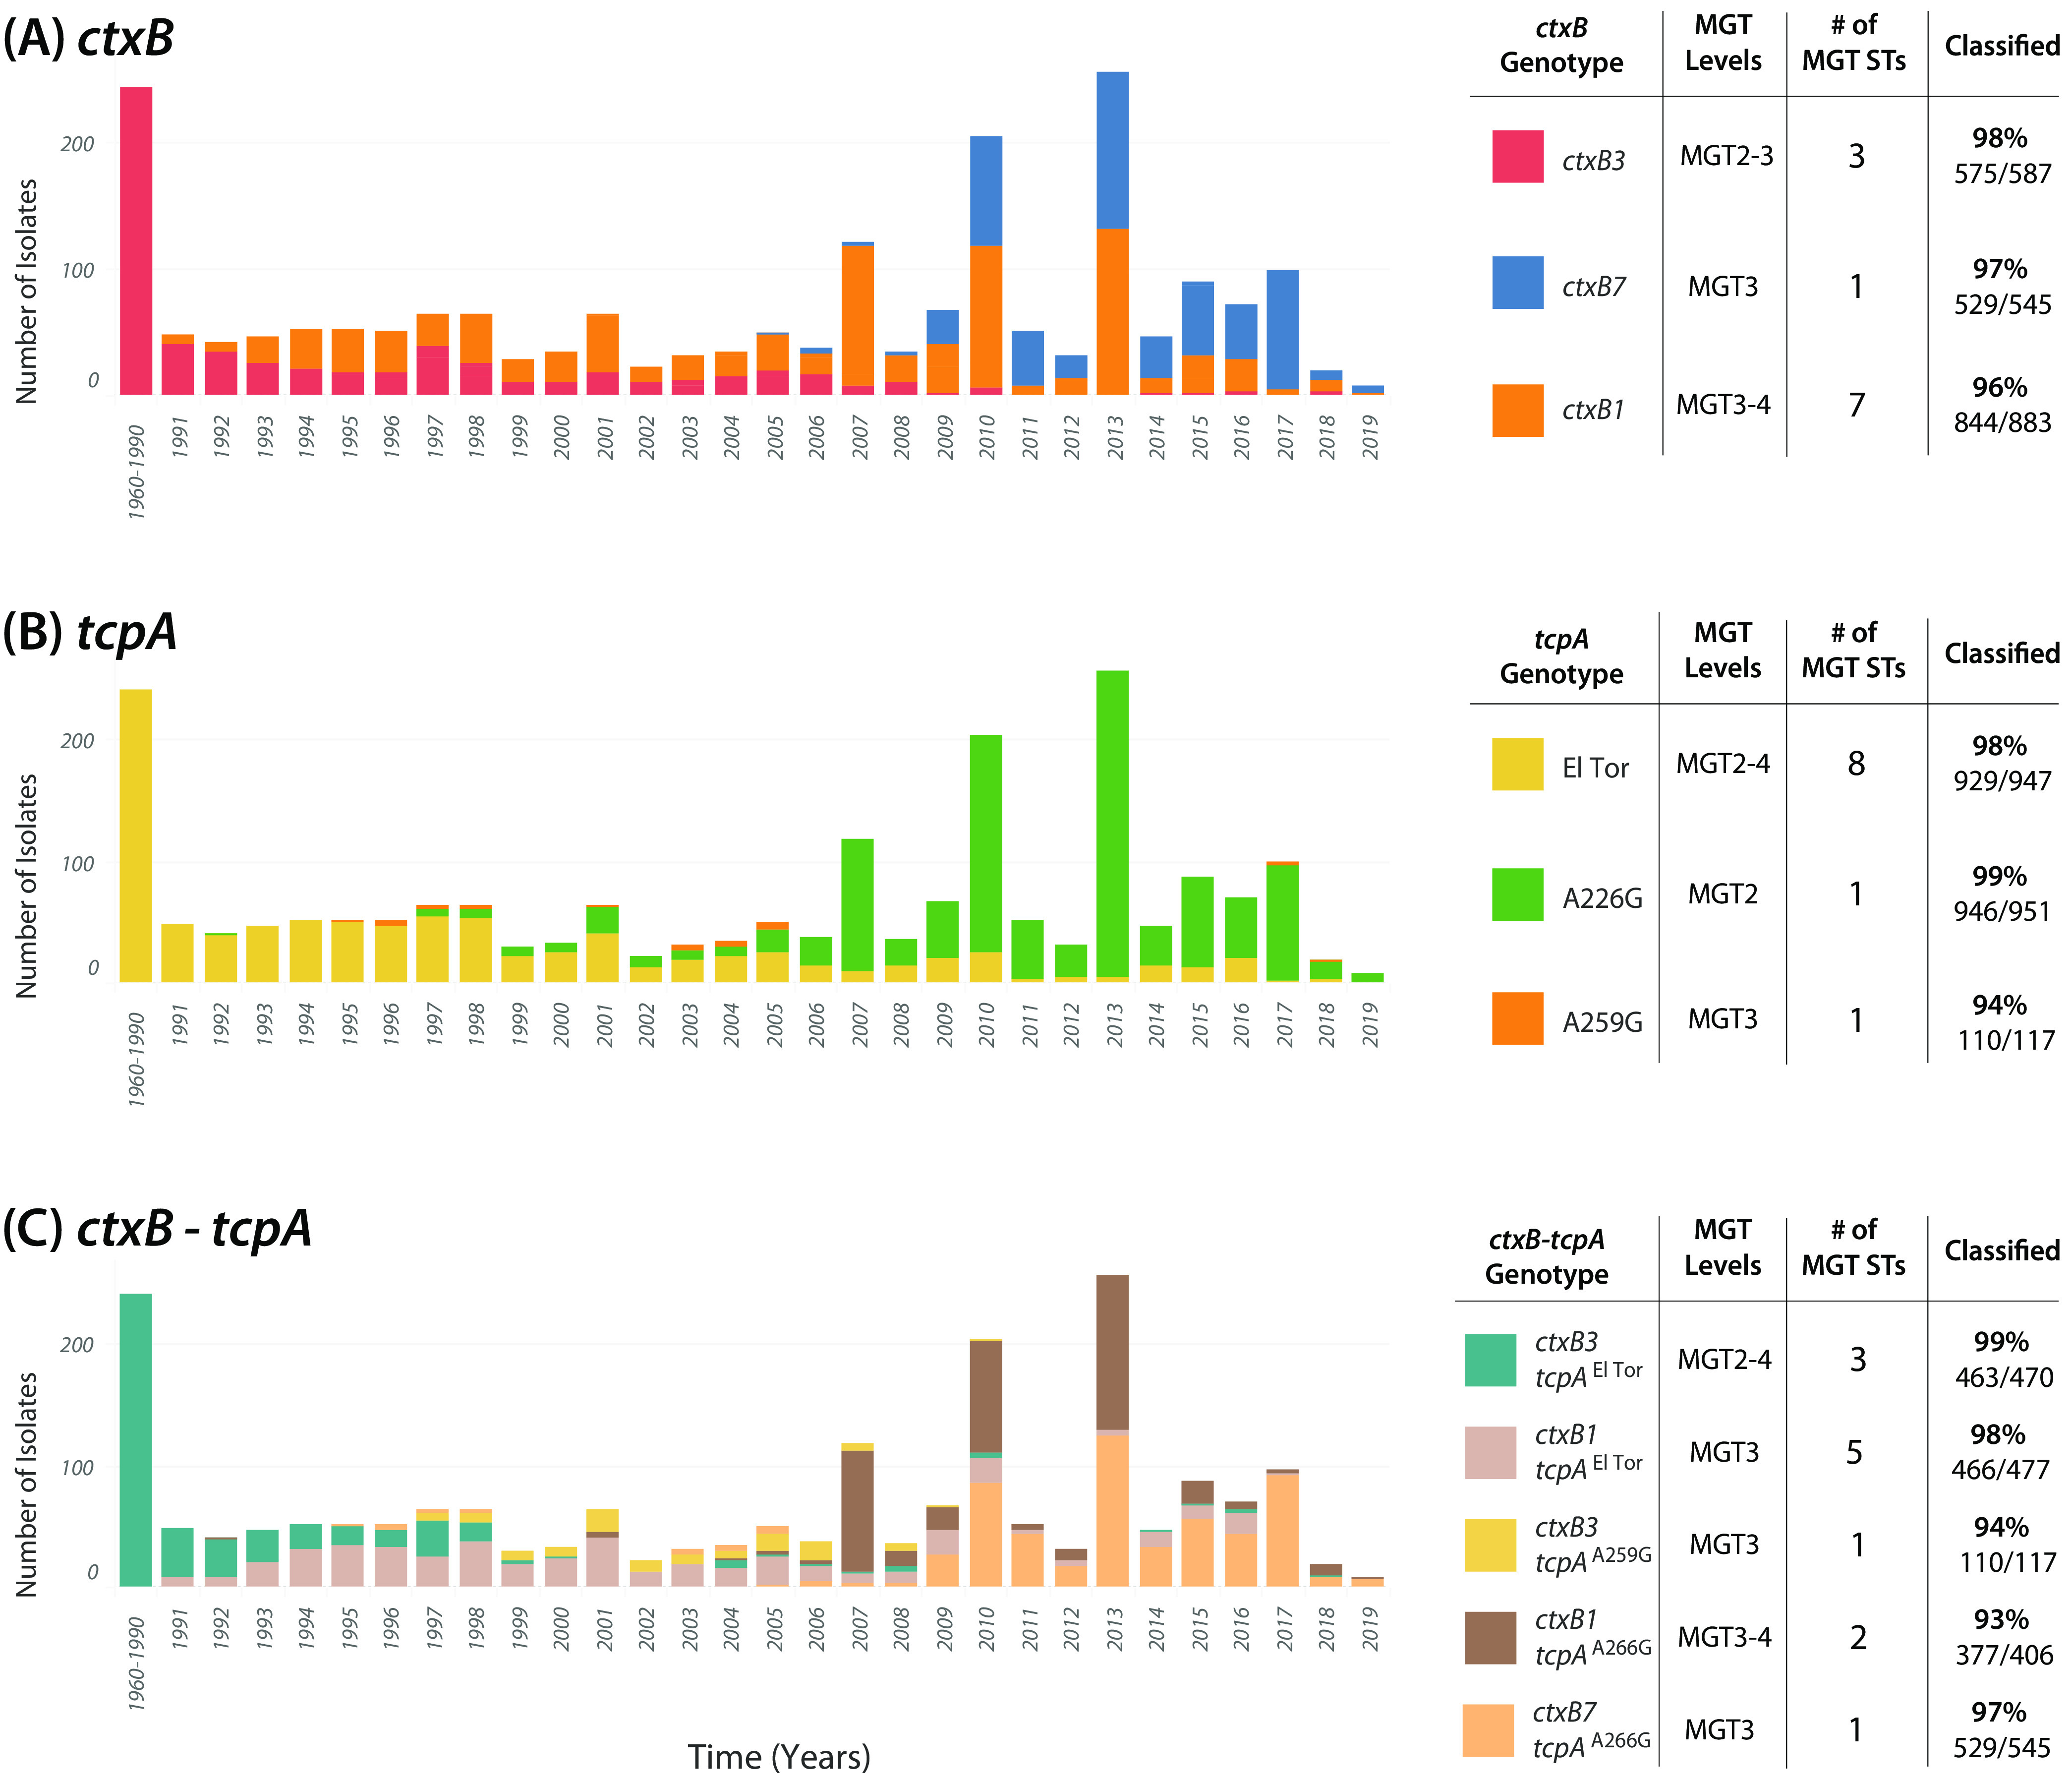
FIG 6.

MGT STs characterized changing seventh pandemic ctxB, tcpA, and ctxB-tcpA genotypes. MGT STs from MGT2 to MGT4 described groups of isolates with the same ctxB (A), tcpA (B), and ctxB-tcpA (C) genotypes (n = 2,015). The frequency of isolates between 1961 and 2019 was as shown. The majority of genotypes were described with more than one ST. STs were mutually exclusive and were included if they contained more than 10 isolates. Isolates are colored by their variant for a marker gene. Graph was visualized using Tableau v9.1 (41).
