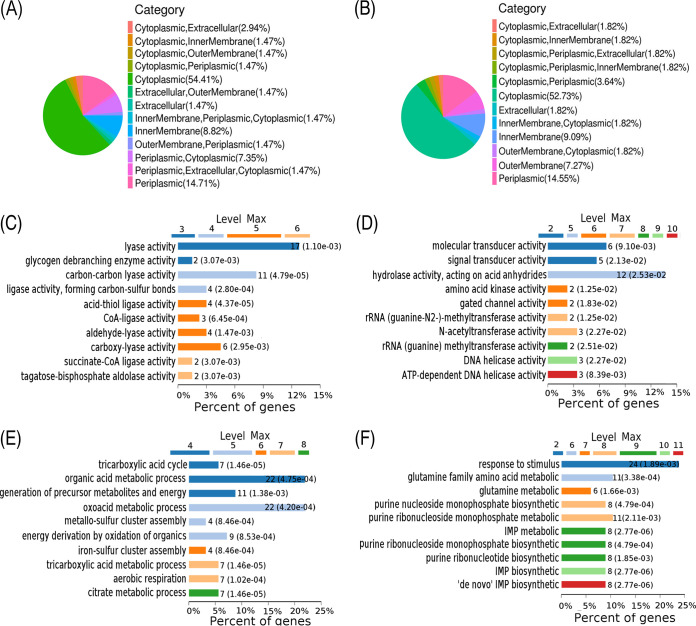
FIG 1.
Subcellular localization, molecular analysis, and biological process analysis of differentially expressed proteins. (A and B) The subcellular localization of differentially expressed proteins. (C and D) Molecular functional analysis of differentially expressed proteins. (E and F) Biological process analysis of differentially expressed proteins. Panels A, C, and E show upregulated proteins, and panels B, D, and F show downregulated proteins. “Max” is the maximal annotated level of this term in the GO graph.

