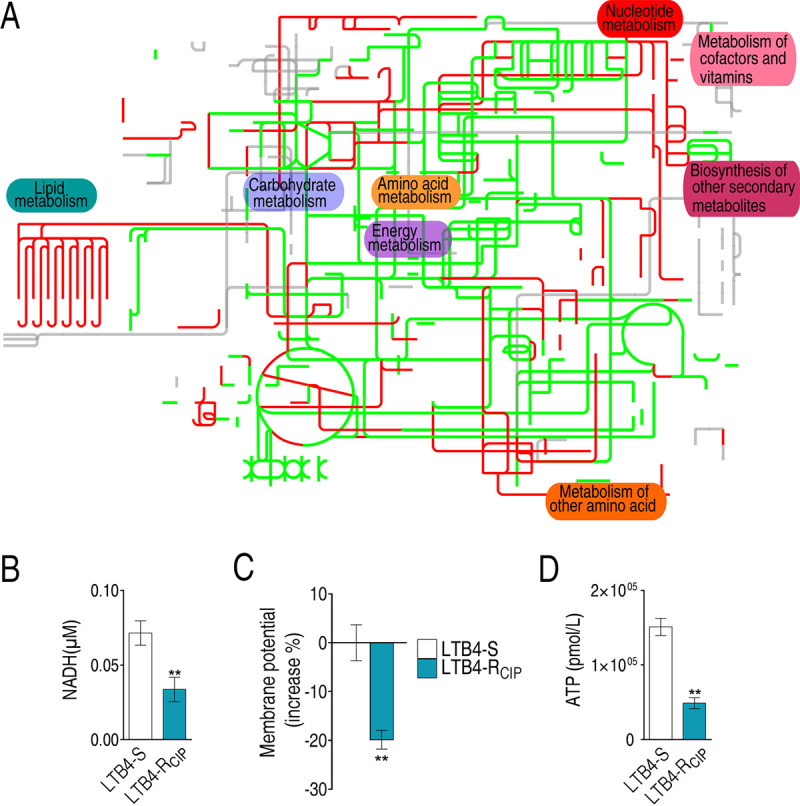
FIG 3.

Metabolic pathway analysis. (A) Analysis for metabolic profiling provides better insight into the effects of differential abundance proteins (P < 0.05). Based on the eggNOG database (http://eggnog5.embl.de/#/app/home), metabolic network pathways were further analyzed using iPath 3.0 (https://pathways.embl.de/). Red, increase; green, decrease; gray, unaffected. (B to D) Differences in NADH concentration (B), membrane potential (C), and ATP level (D) between LTB4-RCIP and LTB4-S. Results in panels B to D are shown as mean ± standard error of the mean (SEM), and P values are identified: *, P < 0.05, and **, P < 0.01, by two-tailed Student's t test.
