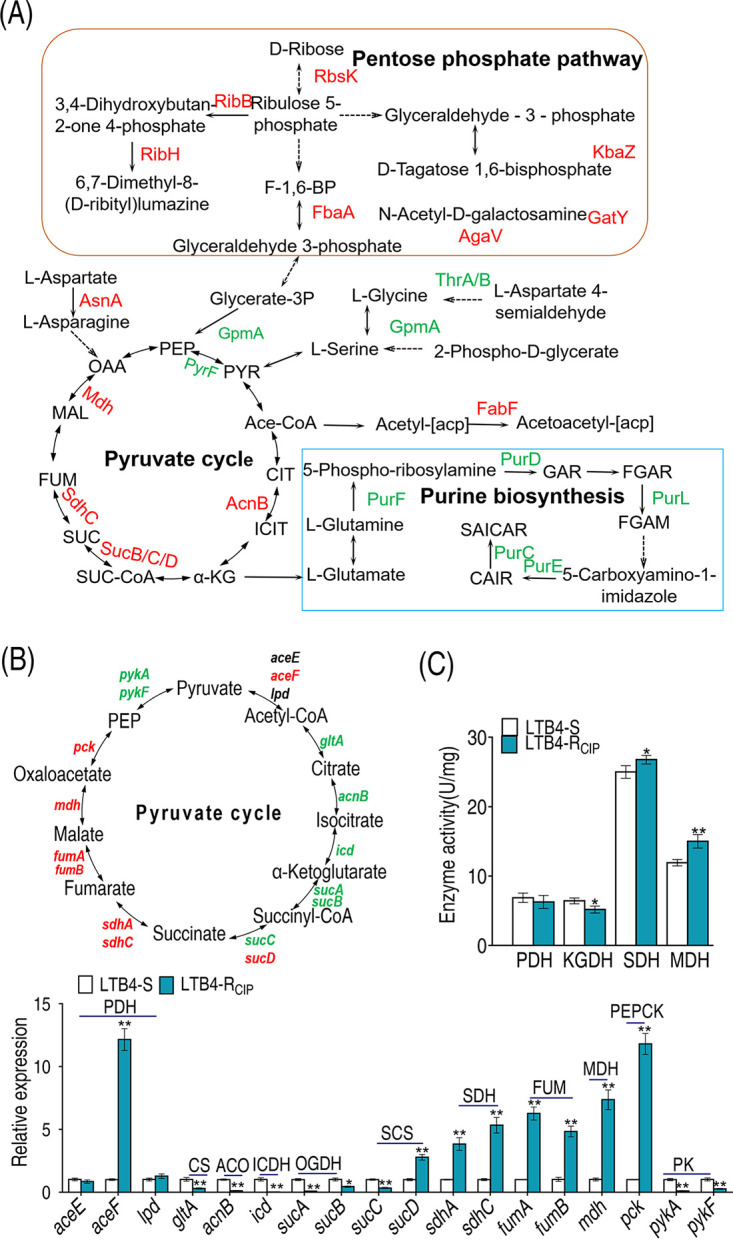
FIG 4.

Analysis of P cycle. (A) Analysis of pathways from proteome data. (B) qRT-PCR analysis of P cycle genes. (C) Activities of PDH, KGDH, SDH, and MDH in the P cycle. The upregulated proteins or genes (in red) and downregulated proteins or genes (in green) are all shown in the flowchart. Results in panels B and C are displayed as mean ± SEM, and P values are identified: *, P < 0.05, and **, P < 0.01, by two-tailed Student's t test. PDH, pyruvate dehydrogenase; KGDH, α-ketoglutarate dehydrogenase; SDH, succinic dehydrogenase; MDH, malate dehydrogenase.
