FIG 8.
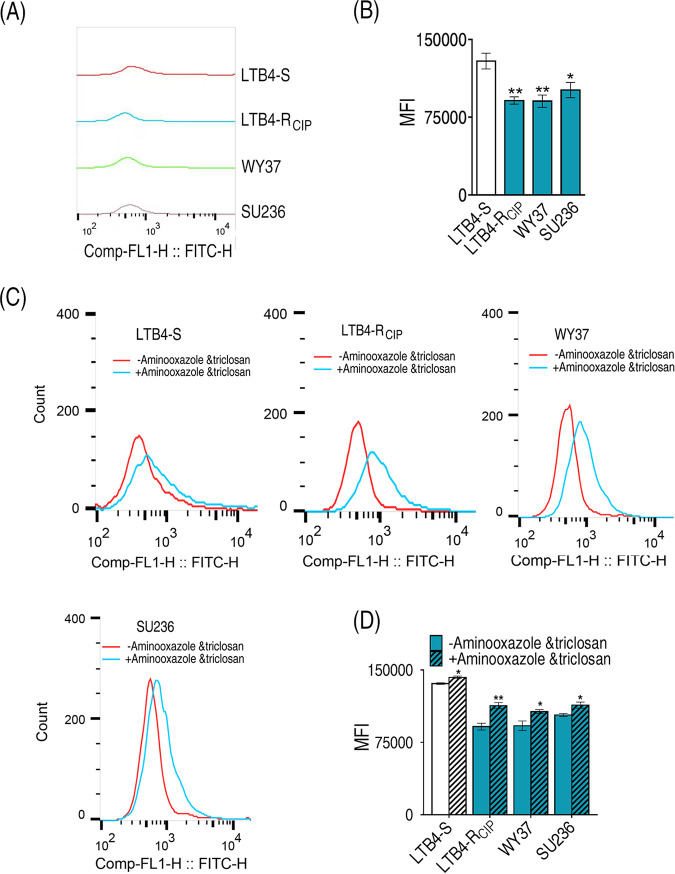
Membrane permeability among E. tarda strains. (A) Single-parameter histogram. (B) Green fluorescence signal intensity. (C) Single-parameter histogram in the presence or absence of 2-aminooxazole and triclosan. (D) Green fluorescence signal intensity in the presence or absence of 2-aminooxazole and triclosan. Results in panels B and D are displayed as mean ± SEM, and significant differences are identified: *, P < 0.05, and **, P < 0.01, by two-tailed Student's t test.

