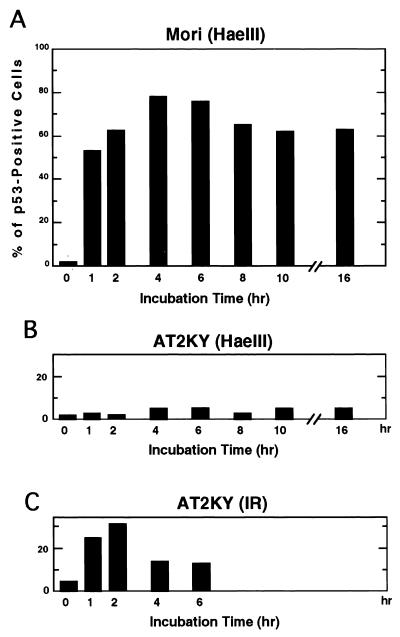
FIG. 2.
Time course of p53 accumulation after microinjection of HaeIII into normal and AT fibroblasts. HaeIII (1 U/μl) was microinjected into either normal (Mori; A) or AT (AT2KY; B) fibroblasts. (C) AT fibroblasts treated with X-rays (20 Gy). The cells were cultured for the indicated periods and stained for p53 protein. The frequency of positive cells was determined as the percentage of cells showing positive staining. Two independently performed experiments gave similar results; representative data from one experiment are shown.

