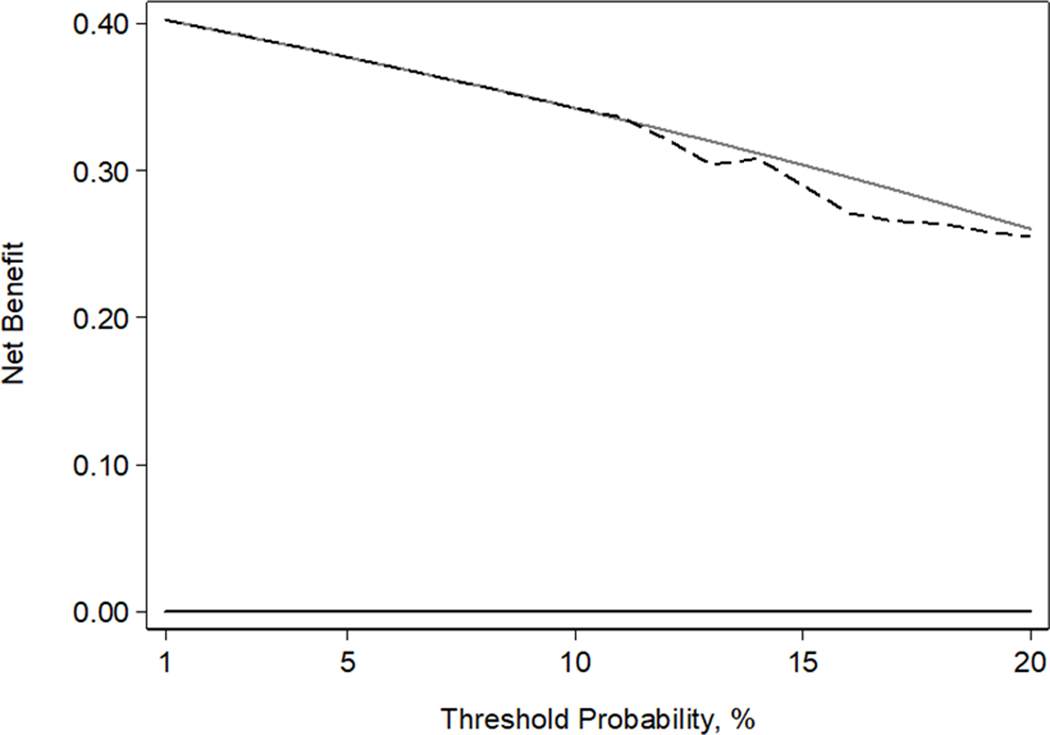
Figure 2.

Decision curve analysis plot. The black dashed line represents net benefit of our predictive model on primary analysis (extensive disease defined as Gleason pattern 4/5 in bilateral lobes, extraprostatic extension, seminal vesicle involvement, or lymph node invasion), the grey solid line represents the treat-all strategy, and the black solid line represents the treat-none strategy.
