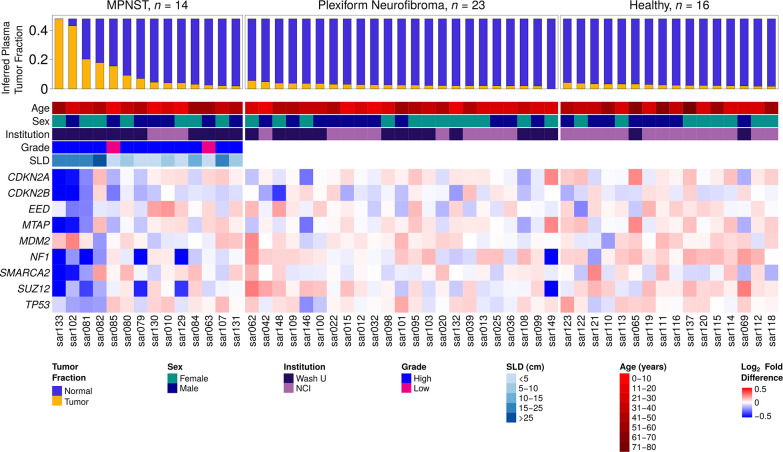
Fig 2. Participant characteristics and CNAs.
Heatmap includes all 53 participants in this study, categorized by diagnosis. Each column represents one study participant with ID labels shown below. Highest tumor fraction in plasma and important tumor and participant characteristics are displayed in the top panel. The lower panel shows CNAs in genes relevant to NF1 and MPNST pathogenesis, depicted as log2 of copy number ratio. CNA, copy number alteration; MPNST, malignant peripheral nerve sheath tumor; NF1, neurofibromatosis type 1; SLD, sum of longest tumor diameters as determined by RECIST 1.1 criteria.

