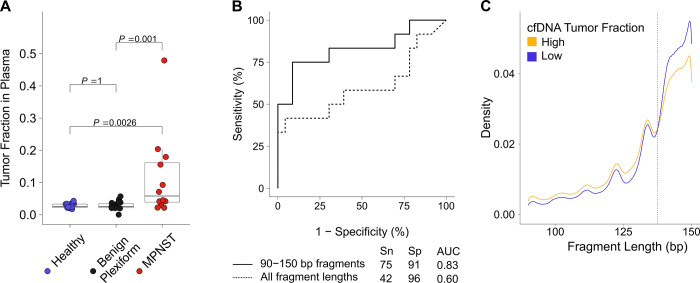
Fig 4. Tumor fraction in plasma stratifies patients by diagnosis.
(A) Tumor fraction in participants with available pretreatment plasma cfDNA (n = 53), stratified by clinical diagnosis, with significance assessed by the Dunn test after Kruskal–Wallis analysis of variance. (B) ROC curve of plasma cfDNA tumor fraction comparing pretreatment MPNST to PN patients. Solid line represents tumor fraction data derived only from 90–150 bp fragments, while dotted line represents tumor fractions derived from all fragment lengths. Confusion matrix is reported separately (S5 Table). (C) Fragment length density for cfDNA in MPNST and PN patients (n = 69 samples) with high (>0.0413) versus low (<0.0413) tumor fractions in plasma as determined by the Youden’s index-optimized cutpoint from the ROC curve. The dashed line highlights an inflection in the curves with high tumor fraction samples enriched for shorter cfDNA fragment sizes (<138 bp) and low tumor fraction samples enriched for longer cfDNA fragment sizes (D = 0.078, P < 0.001 by two-sample Kolmogorov–Smirnov test). Data are shown for sequencing reads within the 90 to 150 bp in silico size-selection range (Methods). AUC, area under the curve; bp, base pairs; cfDNA, cell-free DNA; MPNST, malignant peripheral nerve sheath tumor; PN, plexiform neurofibroma; ROC, receiver operating characteristic; Sn, sensitivity; Sp, specificity.

