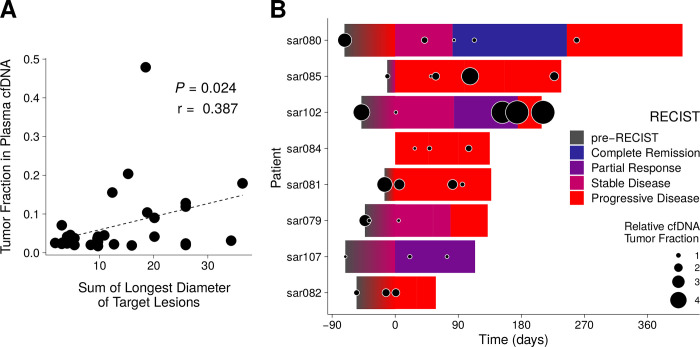
Fig 5. Tumor fraction in plasma correlates with imaging.
(A) SLD of target lesions for all MPNST patients are plotted against each SLD’s temporally closest plasma tumor fraction value (Methods). Pearson correlation coefficient is significant at P = 0.024. (B) Timelines of RECIST classification for MPNST patients that underwent serial monitoring (n = 8; S3 Fig). Overlaid are cfDNA tumor fraction levels, normalized per patient to the lowest value detected on serial analysis, and then log2 transformed (Methods). cfDNA, cell-free DNA; MPNST, malignant peripheral nerve sheath tumor; RECIST, response evaluation criteria in solid tumors, version 1.1; SLD, sum of longest tumor diameters.

