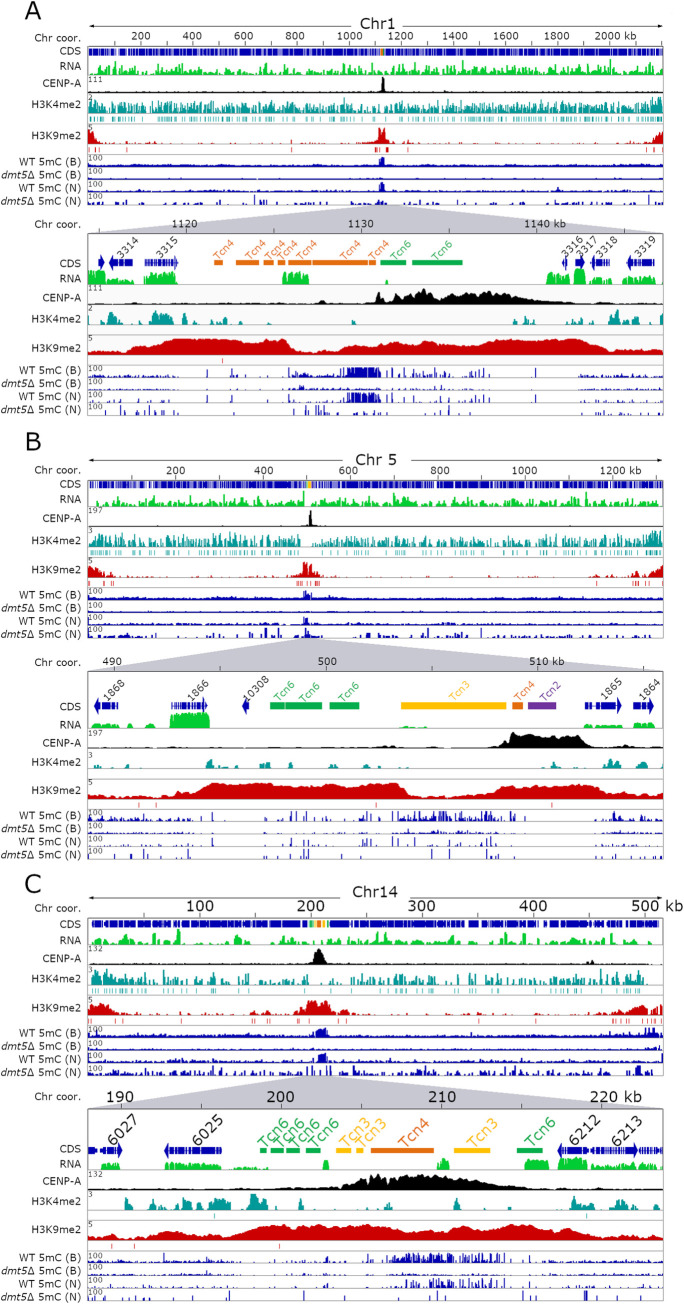
Fig 1. Heterochromatin marks H3K9me2 and 5mC DNA methylation do not always coincide on C. deuterogattii centromeres.
For each panel, the full-length chromosome (Chr) is on the top and the lower section shows a region spanning the native centromere with 2 to 4 flanking genes. Each panel shows the chromosome coordinates, with arrows indicating the gene coding sequences (CDS), TEs present in centromeres, RNA-seq in green, CENP-A reads indicating the native centromere in black, H3K4me2 enrichment in turquoise, H3K9me2 enrichment in red, and 5mC enrichment is shown in blue (for both the wild type and dmt5Δ). 5mC data is derived from either bisulfite sequencing (B) or nanopore sequencing (N). The enrichment of each sample over the input signal is shown on the left of each panel (y-axis). MACS2 was used to validate significant peaks and indicated with a line below the whole peak. Panel (A) shows Chr1, panel (B) shows Chr5, and panel (C) shows Chr14.

