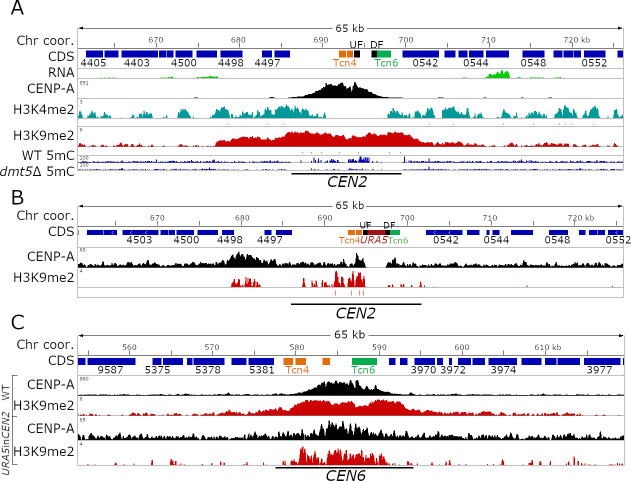
Fig 4. Insertion of a transgene into a native centromere shifts the CENP-A binding.
For all three panels, a detailed centromeric view (65 kb) of CEN2 or CEN6 is shown. Chromosome coordinates are shown on top, CDS are shown in blue, and truncated transposable elements are indicated with their family color. ChIP-seq is shown in black (CENP-A), turquoise (H3K4me2, only wild-type), and red (H3K9me2). UF and DF indicate the 5’ and 3’ region used for homologous recombination. (A) Detailed view of native centromere 2. In addition to the ChIP-seq data, bisulfite sequencing data to analyze 5mC enrichment is shown. (B) Detailed view showing CENP-A and H3K9me2 enrichment in the URA5 insertion strain. The URA5 gene is shown in red. (C) Enrichment level across CEN6 are shown as control for both ChIP-seq experiments which revealed that one experiment showed better enrichment than the other, albeit in the same regions.

