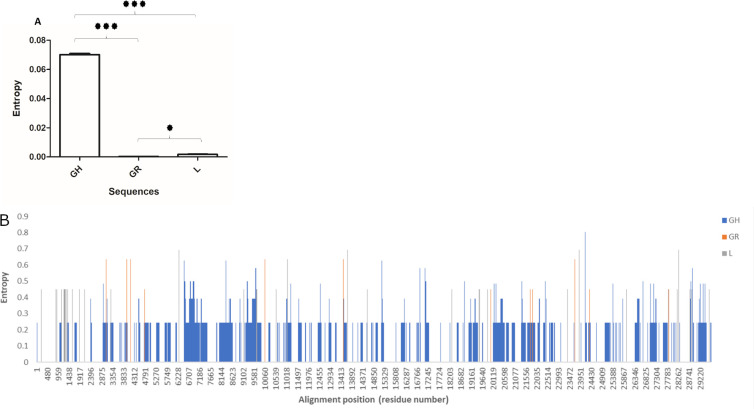
Fig 6. Genome-wide site-by-site entropy analysis for prevalent clades L, GR and GH.
The figure shows A) Mean entropy and B) site-by-site entropy for GH, GR and L clade sequences A) The asterisk above the bars show statistically significant (*** = p<0.001; * = p<0.05) difference between the means. Error bars shown standard error of mean.

