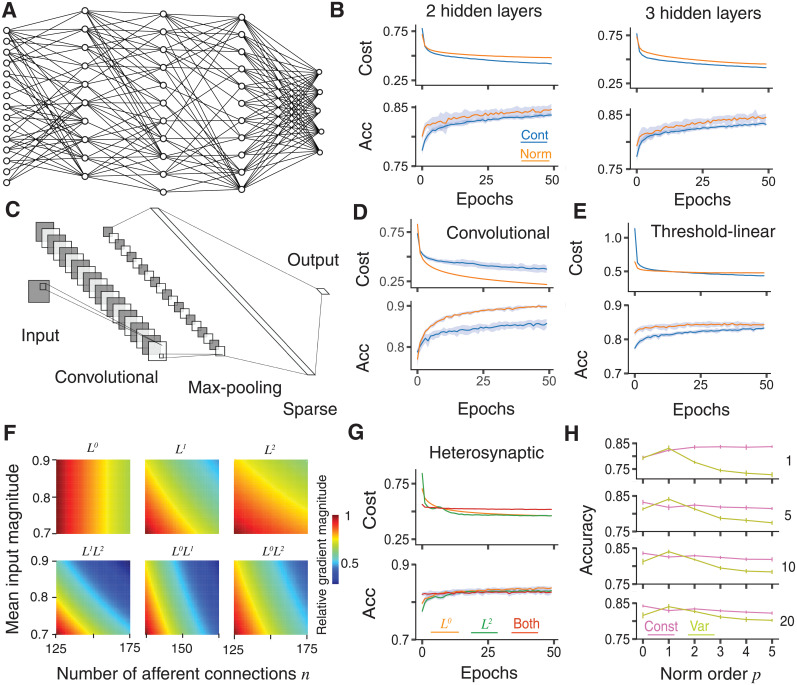
Fig 3. Improved training in deeper networks and comparison with other norms.
A, Schematic of a sparsely connected network with 3 hidden layers. The output layer is fully connected to the final hidden layer, but all other connections are sparse. B, Learning improvement with dendritic normalisation (orange) compared to the unnormalised control case (blue) for networks with 2 (top) and 3 (bottom, see panel A) sparsely-connected hidden layers, each with M = 100 neurons. Top of each: Log-likelihood cost on training data. Bottom of each: Classification accuracy on test data. C, Schematic of a convolutional neural network [46] with 20 5 × 5 features and 2 × 2 maxpooling, followed by a sparsely connected layer with M = 100 neurons. D, Improved learning in the convolutional network described in C for an unnormalised (blue) and normalised (orange) sparsely-connected layer. Top: Log-likelihood cost on training data. Bottom: Classification accuracy on test data. E, Improved learning in a network with one hidden layer with M = 100 threshold-linear neurons for unnormalised (blue) and normalised (orange) sparsely-connected layers. Top: Log-likelihood cost on training data. Bottom: Classification accuracy on test data. F, Contribution of different norm orders to the learning gradients of neuron with different numbers of afferent connections and different mean absolute connection weights. Norms are (left to right and top to bottom): L0 (dendritic normalisation), L1, L2 [37], joint L1 and L2, joint L0 and L1, and joint L0 and L2 (Eq 6). Values are scaled linearly to have the a maximum of 1 for each norm order. G, Comparison of dendritic (orange), heterosynaptic (green [37]), and joint (red, Eq 6) normalisations. Top: Log-likelihood cost on training data. Bottom: Classification accuracy on test data. H, Comparison of test accuracy under different orders of norm p after (from top to bottom) 1, 5, 10, and 20 epochs. Pink shows constant (Eq 8) and olive variable (Eq 9) excitability. Solid lines show the mean over 20 trials and shaded areas and error bars the mean ± one standard deviation. All results are on the MNIST-Fashion dataset. Hyperparameters are ε = 0.2 and ζ = 0.15.

