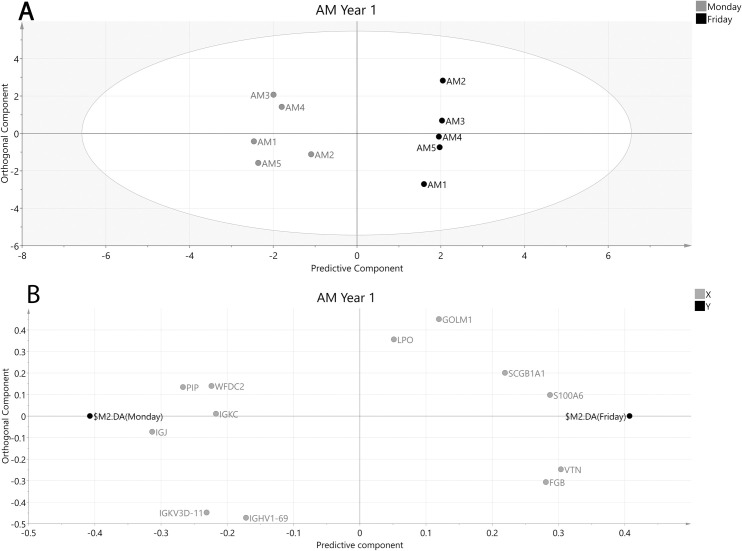
Fig 2. OPLS-DA model of AM operators year 1 after selecting proteins with VIP values ≥ 1.2 and VIP values > standard error (SE).
A: Score plot of participating AM operators at the beginning and end of the week. The x-axis depicts the predictive component most important for separating samples collected Monday (grey circles) vs Friday (black circles) while the y-axis represent the orthogonal component showing in-group variation. R2 = 0.97, Q2 = 0.914, CV-ANOVA p-value = 0.007. B: Loading plot showing the underlying protein separation (X-variables, grey circles) in relation to sampling time point (Y-variables, black circles). FGB—Fibrinogen beta chain, GOLM1—Golgi membrane protein 1, IGHV1-69—Immunoglobulin heavy variable 1–69, JCHAIN—Immunoglobulin J chain, IGKC–Immunoglobulin kappa constant, IGKV3D-11 –Immunoglobulin kappa variable 3–11, LPO–Lactoperoxidase, PIP—Prolactin-inducible protein, S100A6—Protein S100-A6, SCB1A1 –Uteroglobin, WFDC2—WAP four-disulfide core domain protein 2, VTN–Vitronectin.

