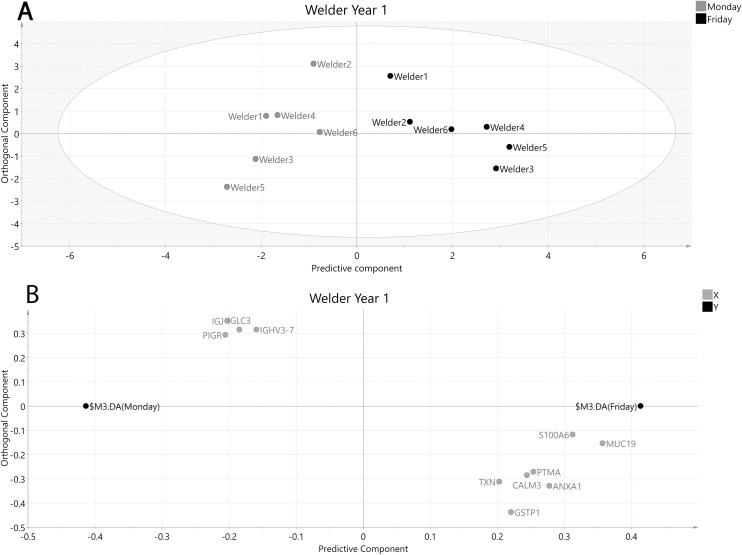
Fig 4. OPLS-DA model of welders year 1 after selecting proteins with VIP values ≥ 1.2 and VIP values > standard error (SE).
A: Score plot of participating welders at the beginning and end of the week. The x-axis depicts the predictive component most important for separating samples collected Monday (grey circles) vs Friday (black circles) while the y-axis represent the orthogonal component showing in-group variation. R2 = 0.84, Q2 = 0.20, p > 0.05. B: Loading plot showing the underlying protein separation (X-variables, grey circles) in relation to sampling time point (Y-variables, black circles). ANXA1—Annexin A1, CALM3—Calmodulin-3, GSTP1—Glutathione S-transferase P, IGHV3-7—Immunoglobulin heavy variable 3–7, IGJ—Immunoglobulin J chain, IGLC3—Immunoglobulin lambda constant 3, MUC19—Mucin-19, PIGR—Polymeric immunoglobulin receptor, PTMA—Prothymosin alpha, S100A6—Protein S100-A6, TXN–Thioredoxin.

