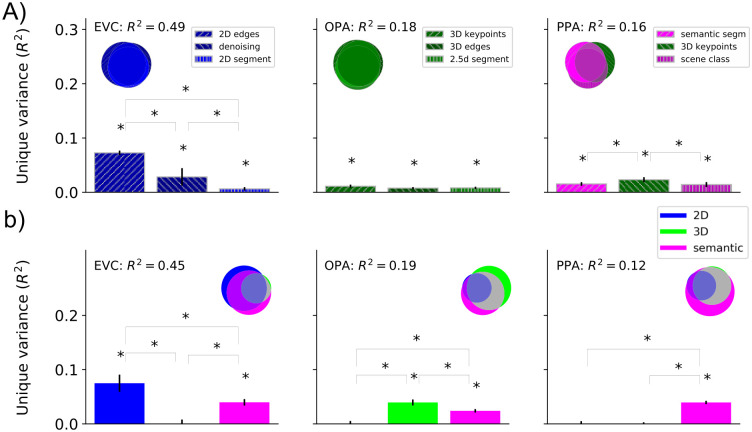
Fig 4. Functional roles of localized ROIs.
A) Absolute total variance (R2) explained in functionally localized ROIs by using the top-3 DNNs together. The Venn diagram for each ROI illustrates the unique and shared variance of the ROI responses explained by the combination of the top-3 DNNs. The bar plot shows the unique variance of each ROI explained by each of the top-3 DNNs individually. The asterisk denotes the significance of unique variance and the difference in unique variance (p<0.05, permutation test with 10,000 iterations, FDR-corrected across DNNs). The error bars show the standard deviation calculated by bootstrapping 90% of the conditions (10,000 iterations). B) Absolute total variance (R2) explained in functionally localized ROIs by using 3 DNN RDMs averaged across task groups (2D, 3D, or semantic). The Venn diagram for each ROI illustrates the unique and shared variance of the ROI responses explained by the combination of 3 DNN task groups. The bar plot shows the unique variance of each ROI explained by each task group individually. The asterisk denotes whether the unique variance or the difference in unique variance was significant (p<0.05, permutation test with 10,000 iterations, FDR-corrected across DNNs). The error bars show the standard deviation calculated by bootstrapping 90% of the conditions (10,000 iterations).

