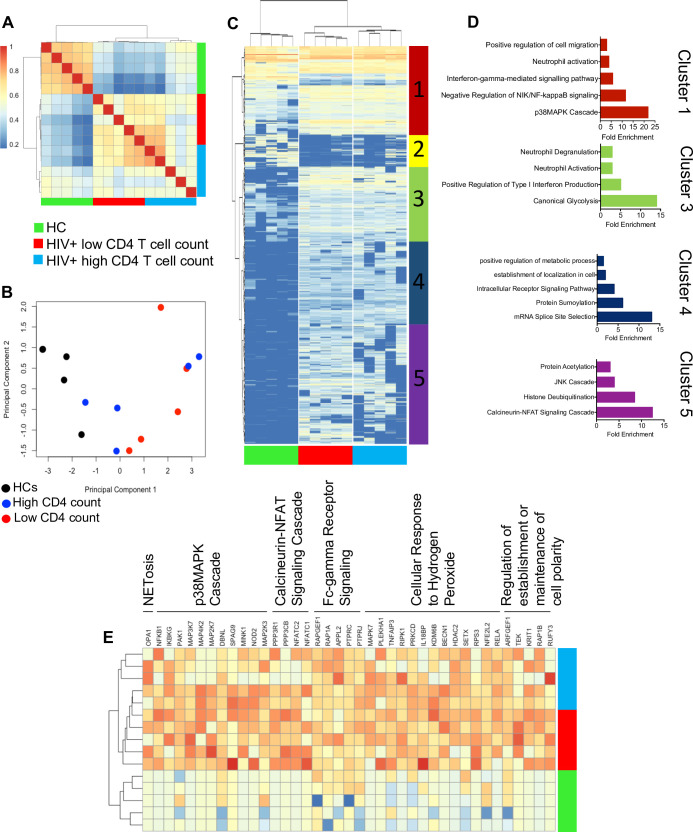
Fig 1. Neutrophils from HIV-infected individuals have a transcriptionally activated phenotype.
(A) Correlation heatmap representing DEGs in neutrophils from HCs, HIV patients with high and low CD4 T-cell count. (B) PCA plot representing the differences between HIV-infected patients with high and low CD4 T-cell count or HCs. (C) A clustered heatmap showing the differences between individual genes between HIV patients with low and high CD4 T-cell count and HCs (DEGs have an FDR <0.05 and a log FC >2 or <−2). (D) Graphs representing gene ontologies significantly associated with the heatmap clusters (FDR < 0.05). (E) Significantly increased genes expressed in neutrophils from HIV patients contributing to gene ontologies. DEG, differentially expressed gene; FC, fold change; FDR, false discovery rate; HC, healthy control; JNK, c-Jun N-terminal kinase; PCA, principal component analysis.

