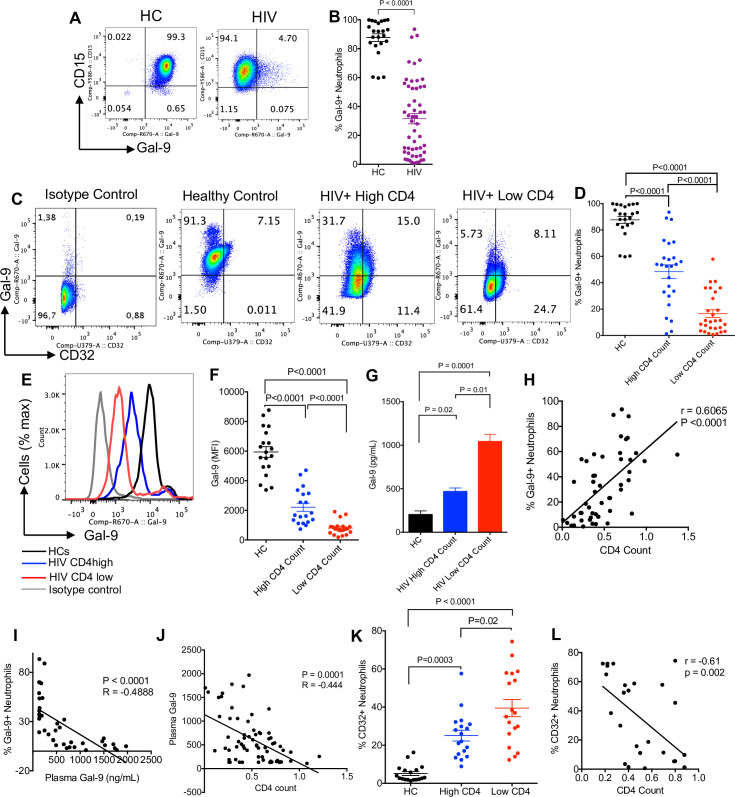
Fig 3. Neutrophils shed Gal-9 in HIV infection.
(A) Representative plots and (B) cumulative data showing Gal-9 expression on neutrophils of HCs versus HIV-infected individuals. (C) Representative plots showing surface expression of Gal-9 and CD32 on neutrophils. (D) Cumulative data comparing surface expression of Gal-9 in neutrophils from HCs versus HIV patients with high and low CD4 T-cell count. (E) Representative histogram and (F) MFI of surface Gal-9 on neutrophils from HIV patients with high CD4 or low CD4 T-cell count and HCs. (G) ELISA results showing the concentration of soluble Gal-9 from unstimulated neutrophils obtained from HCs or HIV patients cultured for 8 hours. (H) Correlation between CD4 T-cell count and Gal-9+ neutrophils. (I) Correlation between Gal-9+ neutrophils and plasma Gal-9 in HIV patients. (J) Negative correlation between plasma Gal-9 and CD4 T-cell count in HIV patients. (K) Percentages of CD32-expressing neutrophils in HCs and HIV patients with high and low CD4 T-cell count. (L) Negative correlation between CD32 expression and CD4 T-cell count in HIV patients. The underlying data can be found in S1 Data. Gal-9, Galectin-9; HC, healthy control; MFI, median fluorescence intensity.

