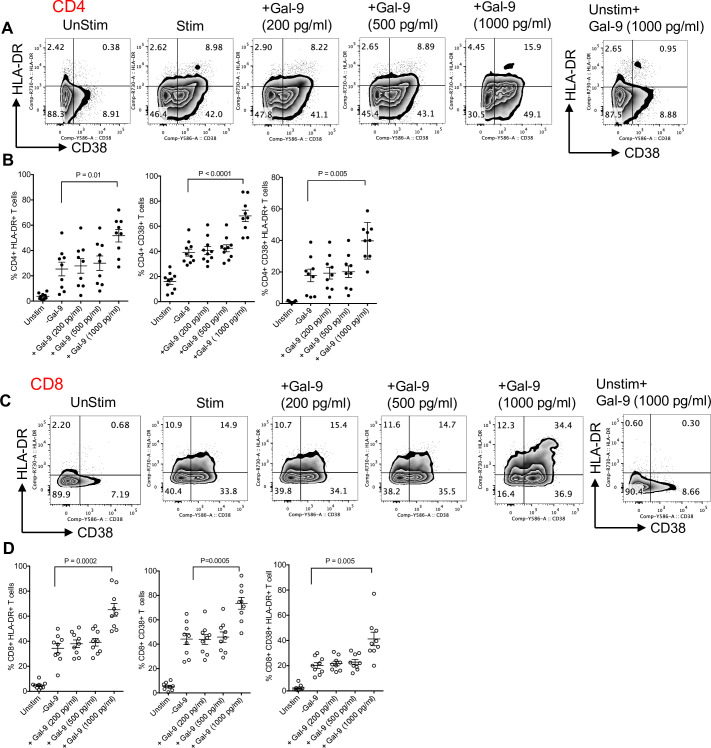
Fig 4. High concentrations of Gal-9 contribute to T-cell activation.
(A) Representative flow cytometry plots and (B) cumulative data of percentages of CD4+ T cells expressing CD38, HLA-DR, and both when cultured and stimulated in the absence or presence of exogenous Gal-9 (200, 500, or 1,000 pg/ml) in vitro. (C) Representative flow cytometry plots and (D) cumulative data of percentages of CD8+ T cells expressing CD38, HLA-DR, and both when cultured and stimulated in the absence or presence of exogenous Gal-9 (200, 500, or 1,000 pg/ml) in vitro. The underlying data can be found in S1 Data. Gal-9, Galectin-9.

