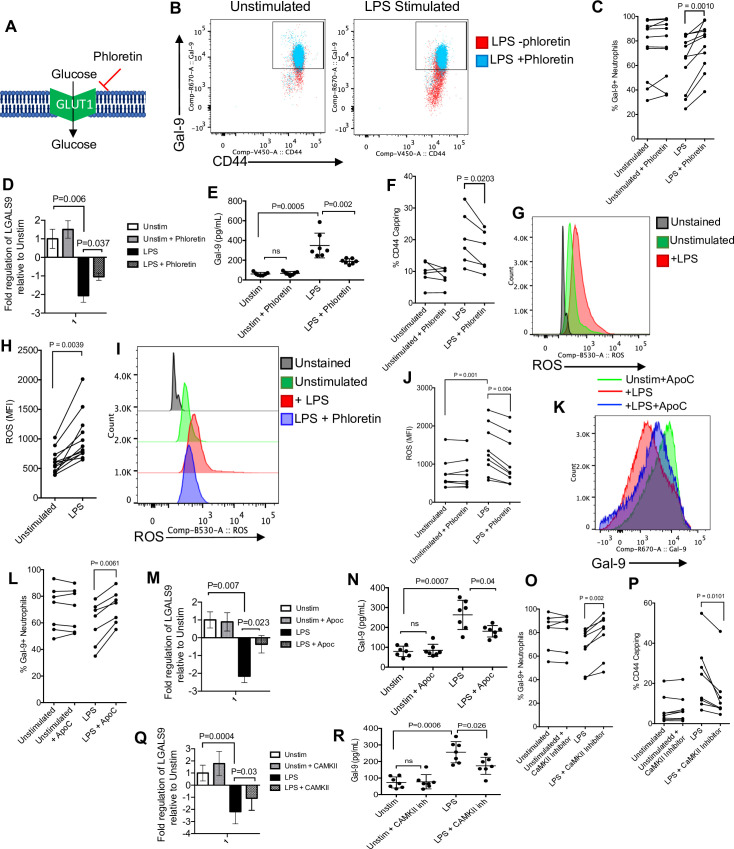
Fig 7. Gal-9 shedding by activated neutrophils is regulated by ROS and CaMKII.
(A) Visual model showing the mechanistic action of phloretin on the GLUT1 transporter. (B) Representative plots showing the effect of phloretin on Gal-9 shedding. (C) Cumulative data showing surface Gal-9 expression in untreated or LPS-treated neutrophil in the presence or absence of phloretin. (D) Cumulative data of Gal-9 mRNA expression and (E) shed Gal-9 in culture supernatants of LPS-activated neutrophils in neutrophils from HCs once stimulated with LPS for 3 hours in the presence or absence of phloretin. (F) Cumulative data showing percent CD44 capping in the presence or absence of phloretin in untreated or LPS-treated neutrophils. (G) Representative plots and (H) cumulative data representing the MFI of ROS in untreated and LPS-treated neutrophils. (I) Representative plots and (J) cumulative data showing the change in MFI of ROS expression in the presence or absence of LPS and phloretin. (K) Representative histogram and (L) cumulative data showing percent Gal-9 expression in the absence and presence of LPS and LPS + Apoc. (M) Cumulative data of Gal-9 mRNA expression and (N) shed Gal-9 in culture supernatants of LPS-activated neutrophils in neutrophils from HCs once stimulated with LPS for 3 hours in the presence or absence of Apoc. (O) Cumulative data showing percent Gal-9 expression and (P) CD44 capping in the absence or presence of LPS and a CaMKII inhibitor. (Q) Cumulative data of Gal-9 mRNA expression and (R) shed Gal-9 in culture supernatants of LPS-activated neutrophils in neutrophils from HCs once stimulated with LPS for 3 hours in the presence or absence of CAMKII inhibitor. The underlying data can be found in S1 Data. Apoc, Apocynin; CaMKII, calcium/calmodulin-dependent protein kinase II; Gal-9, Galectin-9; HC, healthy control; LPS, lipopolysaccharide; MFI, median fluorescence intensity; ROS, reactive oxygen species.

