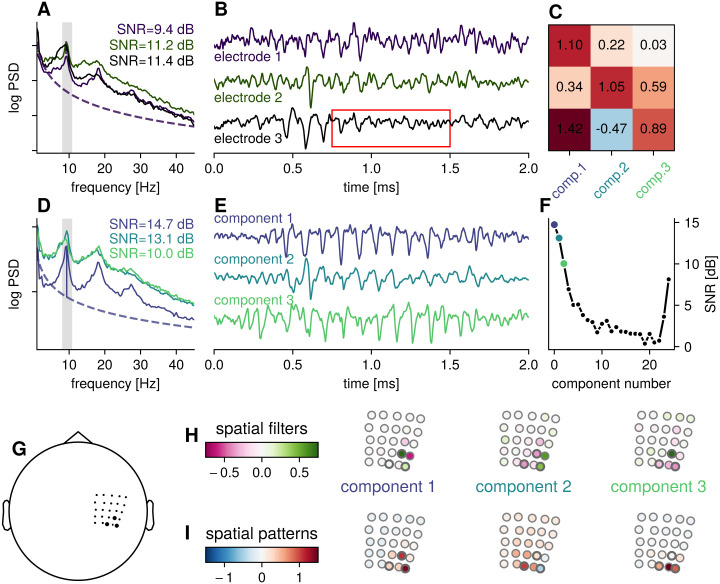
Fig 2. Example: Spatial mixing of sensorimotor rhythms for one participant.
A) Power spectral densities for three channels along the sensorimotor strip. The gray bar indicates the frequency band defined as the signal contribution for estimating the SSD spatial filters. The power spectrum shows a peak frequency in the alpha-band, with additional harmonic peaks. The channels were selected a according to highest SNR in the chosen frequency range. B) The corresponding signal in the time domain showing oscillatory bursts in the alpha-band, amplitudes are normalized for comparison of time courses. The red box marks a time period in which less pronounced oscillations can be seen in the electrode signals, but the oscillatory power of the constituent SSD components is not decreased. C) Coefficients in the spatial patterns for the selected electrodes, i.e., electrode 2 can be approximated as a linear combination of: e2 = 0.34 component1 + 1.05 component2 + 0.59 component3. D) Power spectral densities for the first three components as estimated by SSD, showing a higher alpha-SNR, with less spectral peaks in flanking frequency bands. E) Time domain signal for the corresponding three components, showing pronounced sensorimotor bursts, normalized amplitudes for comparison of time courses. F) SNR per component, for all 25 components. The SNR drops off fast, only a number of components need to be inspected. For the components last in the sequence, the SNR increases as rhythms in flanking bands increase spectral power also in the band of interest. G) Approximate location of the ECoG-grid in head coordinates. The black markers highlight the electrodes shown in A) and B). H) Spatial filter coefficients showing similarity to bipolar and Laplacian-type filters. I) Spatial pattern coefficients showing focal contributions from sources along the sensorimotor strip.

