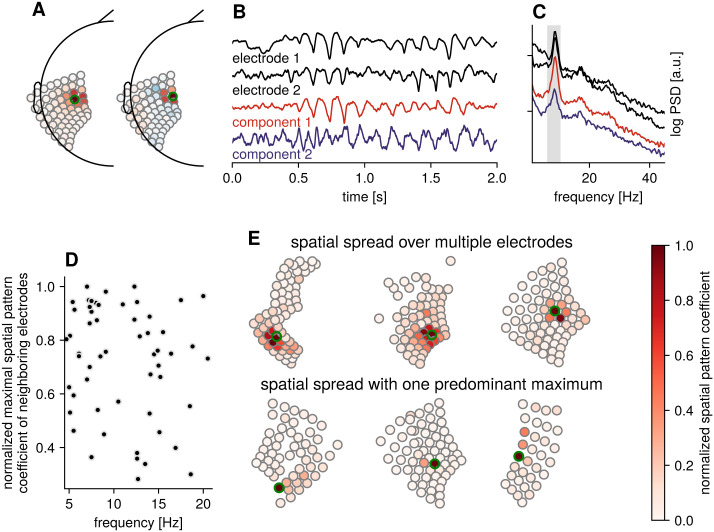
Fig 4. Identifying independent sources.
A) Spatial patterns for two components with electrodes highlighted in green. B) Time domain activity for two neighboring electrodes (black) and the top SNR components for alpha range (gray span in the spectrum in C), showing that the oscillatory activity is largely captured by the first component, with a smaller alpha component in the second component that is otherwise masked in the electrode activity. C) Power spectral densities for electrode and component signals. D) Spatial spread for components with different peak frequency showing large variation. Each circle corresponds to one component. E) Example spatial pattern coefficients visualized on electrode grids, for high spatial spread (top row), where a component contributes to activity of many electrodes and low spatial spread (bottom row) with a single maximum. In contrast to A), the absolute value is plotted here to better illustrate the spread, regardless of polarity. The electrode with the largest coefficient is marked with a green circle.

