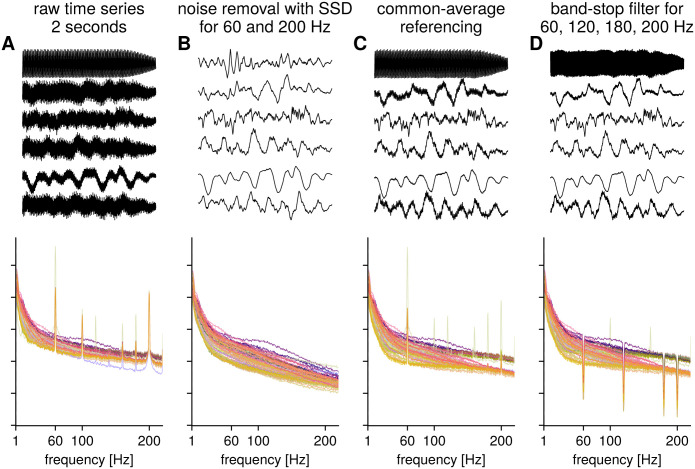
Fig 7. Illustration: Removal of noise with spatial filters for ECoG data.
A) Time series of six electrodes and power spectra for raw ECoG recording for 87 electrodes, color code corresponds to electrode position, with neighboring electrodes having a similar color. B) Time series and power spectra after removal of components maximizing SNR for 60 Hz and 200 Hz spectral peaks. Note that there are no band-stop type artefacts in the spectrum since no temporal filtering was performed. C) Time series and power spectra after common average referencing. While the 200 Hz noise is largely attenuated, 60 Hz line noise still persists. D) Time series and power spectra after common average referencing and then band-stop filtering. The band-stop filters introduce artefacts in the spectral domain.

