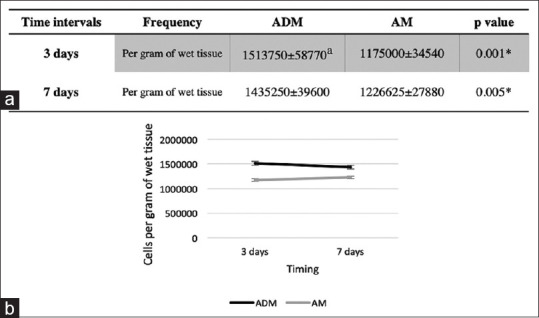
Figure 5.

Macrophage infiltration assessment. (a) Number of macrophages at different sites and time intervals. (b) Representative data for CD68+ cells based on the CD68+ gate; the numbers indicate the absolute number of macrophages per gram of wet tissue. aData are expressed as mean ± standard error of the mean for 28 patients/group. *indicates P < 0.05
