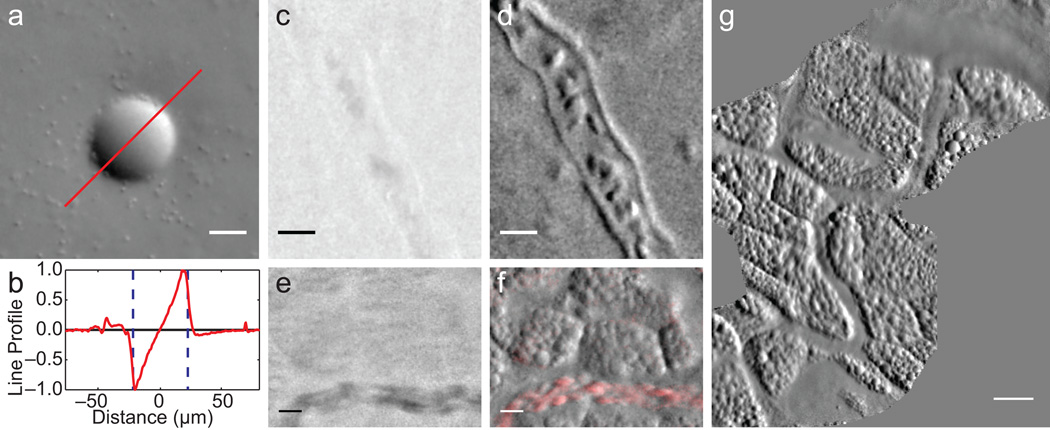
Figure 2.
Demonstration of OBM in a tissue phantom and in vivo. (a) Phase gradient image of a 45 µm polystyrene bead in scattering medium (2 µm beads mixed in agarose, Supplementary Video 1). Note 2 µm beads are readily visible. (b) Corresponding phase gradient profile. (c-f) Simultaneously acquired absorption (c,e) and phase gradient (d,f) images of the CAM vascular system of day 11 chick embryo in ovo. Individual red blood cells (RBCs) and vessel walls are clearly visible (Supplementary Video 2). (f) Moving RBCs are highlighted in red using a sliding 3-frame temporal variance filter (Supplementary Video 3). (g) A CAM vasculature mosaic reconstructed from Supplementary Videos 4,5. Scale bars are (a,c-f) 20 µm, and (g) 50 µm.

