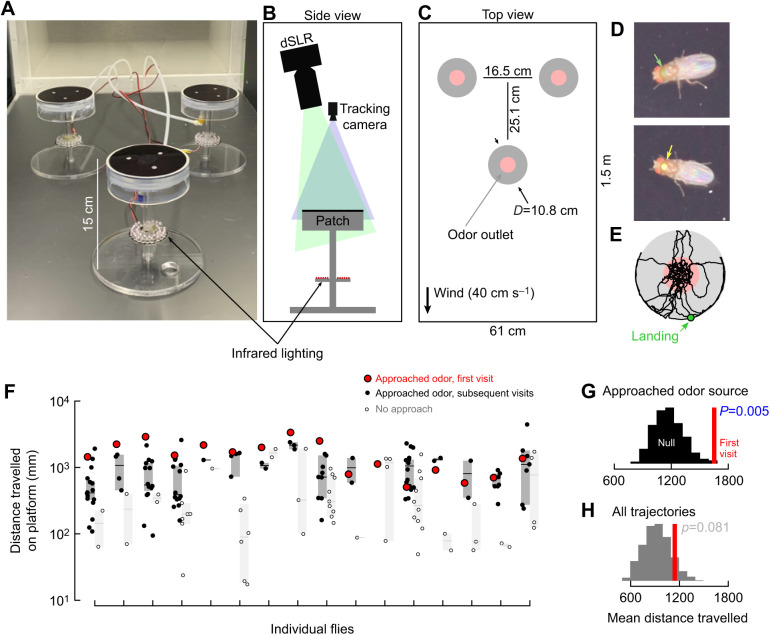
Fig. 1.
Flies explore odorous objects longer on their first encounter. (A) Photograph of experimental arrangement of three odor emitting patches inside a 60×60×120 cm wind tunnel (ELD, Lake City, MN, USA). (B) Above each patch was a machine vision camera to track the flies’ walking trajectories, and a digital SLR to image their markings. All six cameras were positioned to maximize the size of the patch in the field of view. (C) Top view diagram of experimental arrangement, red shading indicates approximate region where ethanol odor was emitted (see van Breugel et al., 2018). (D) Representative photographs of flies indicating their identifying color spots painted on with nail polish. (E) Representative trajectory on one patch. (F) Distance travelled on the patch by individual flies that approached the odor (black) or did not (white). Red: first approach. Shading indicates 95% confidence interval about the median. (G,H) Histograms show bootstrapped distributions of the expected mean distance flies should travel if each visit is identical and independent. Red line shows the actual mean distance travelled only the first visit. In G, only trajectories where the flies approached the odor were considered. In H, all trajectories were considered.

