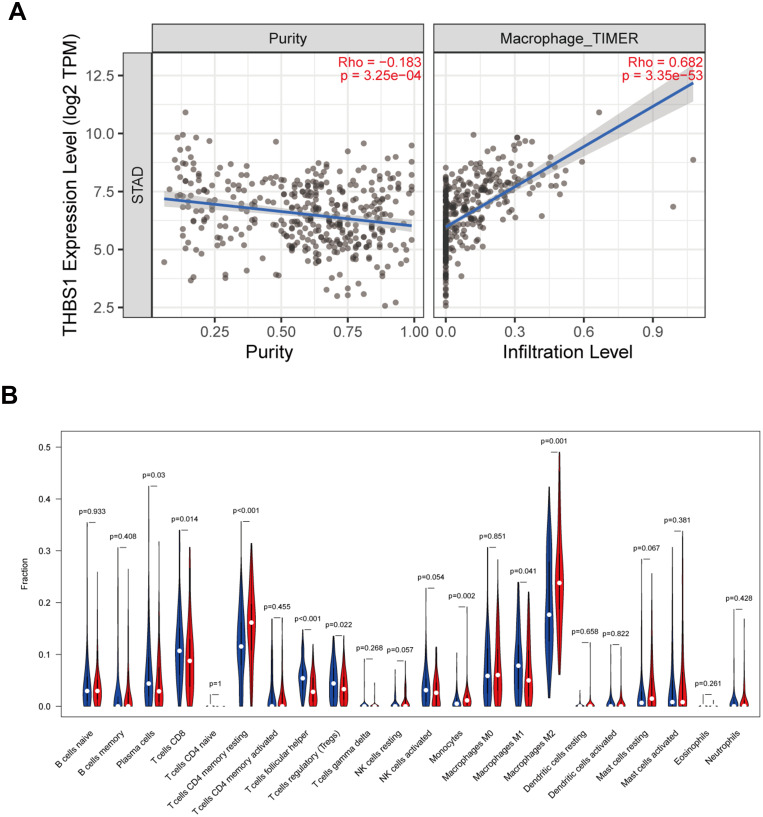
Figure 7.
Relationship between THBS1 and immune infiltration. (A) THBS1 expression relates to immune cell infiltration levels in STAD. (B) Relationship between high and low expression of THBS1 in 22 types of tumor-infiltrating immune cells, the blue violin diagram presented low THBS1 expression group, and the red violin diagram presented high THBS1 expression group.

