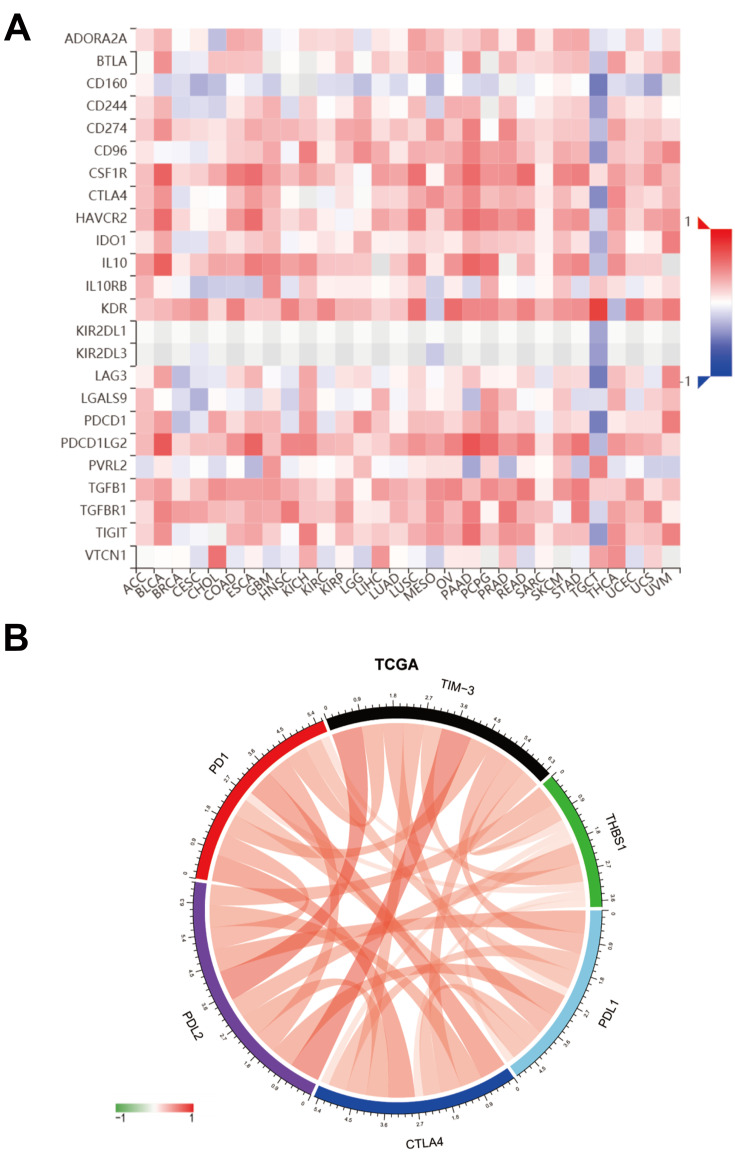
Figure 9.
Correlation of THBS1 with immune checkpoint members. (A) THBS1 expression is correlated with immunoinhibitors in pan-cancer, red represents positive correlation, blue represents negative correlation, the deeper the color, the stronger the correlation. (B) THBS1 expression is correlated with immune checkpoint members in TCGA-STAD, red represents positive correlation, green represents negative correlation.

