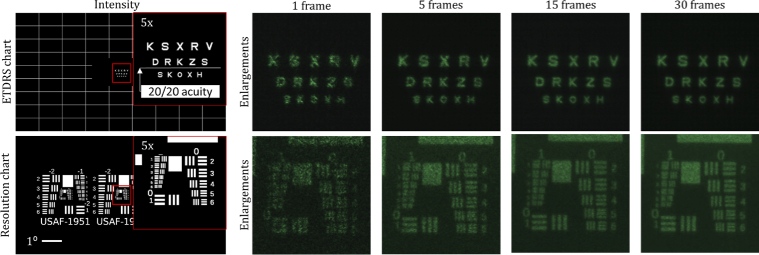
Fig. 8.
Photographs of holographic images displayed with the prototype for user evaluation. The intensity targets (ETDRS chart and USAF-1951 resolution chart) are provided with five-times enlarged views. The white bar represents one degree of visual angle. The Sloan letters in the ETDRS chart correspond to 0.1, 0.0, −0.1 logMAR from the top row to the bottom, respectively. The captured results of the holographic images depending on the number of hologram frames utilized for temporal multiplexing are provided.

