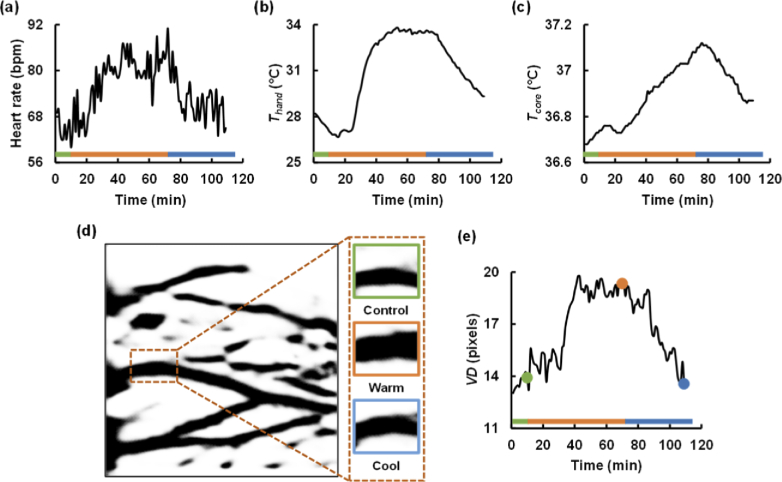
Fig. 4.
Thermal response of one subject to core temperature (Tcore) elevation. The green, orange, and blue bars in the panels indicate the resting, heat stress, and relaxation phases, respectively. Heart rate (HR), hand skin temperature (Thand), and Tcore increased at the thermal stress phase and decreased at the relaxation phase, as shown in (a), (b), and (c), respectively. (d) Processed images of dorsal metacarpal vein in a region of interest (ROI) under control, warm, and cool conditions. The insets are cropped images of the veins in the ROI at different time points indicated in (e). (e) Vein diameter (VD) versus time plot, showing that the VD variation follows the trend of Tcore change.

