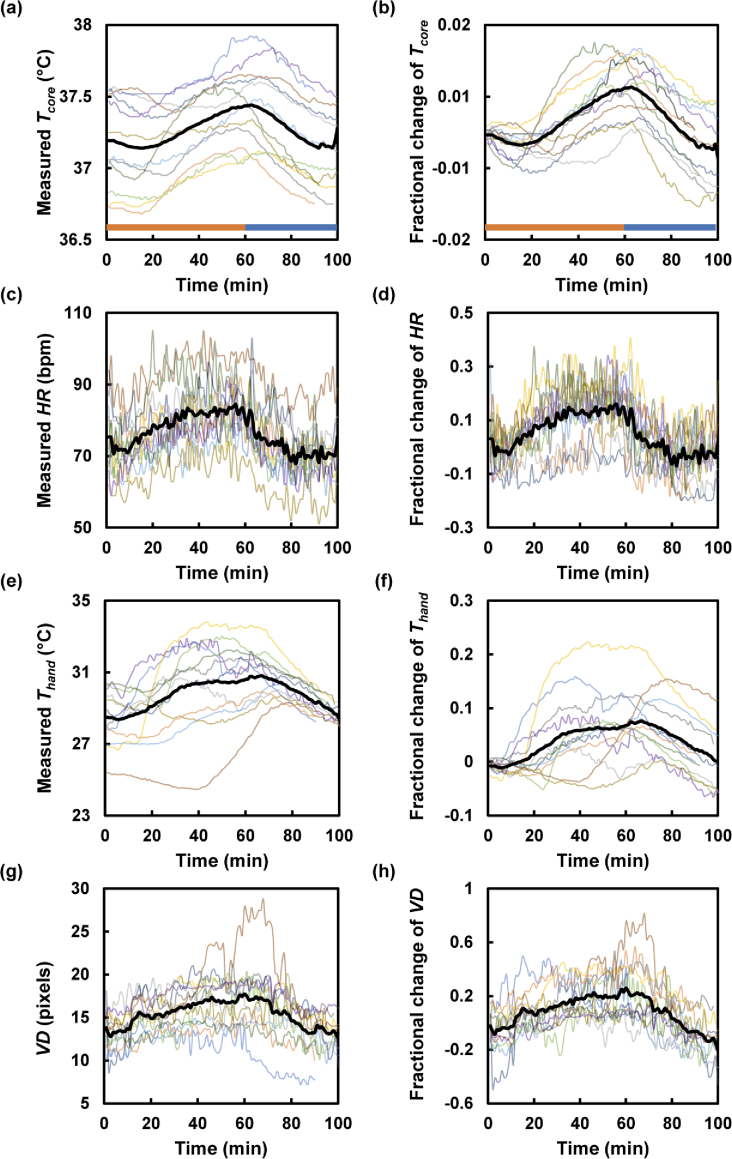
Fig. 5.
Thermal responses of all subjects (n = 12) after leg immersion in hot water for 60 min. The plots in (a), (c), (e), and (g) include raw data for Tcore, HR, Thand, and VD response measured every 1 min, respectively. The plots in (b), (d), (f), and (h) show fractional changes in Tcore, HR, Thand, and VD, respectively. The orange and blue bars in (a) and (b) indicate the thermal stress and relaxation phases, respectively. The black solid lines show the average of the thermal responses of all subjects.

