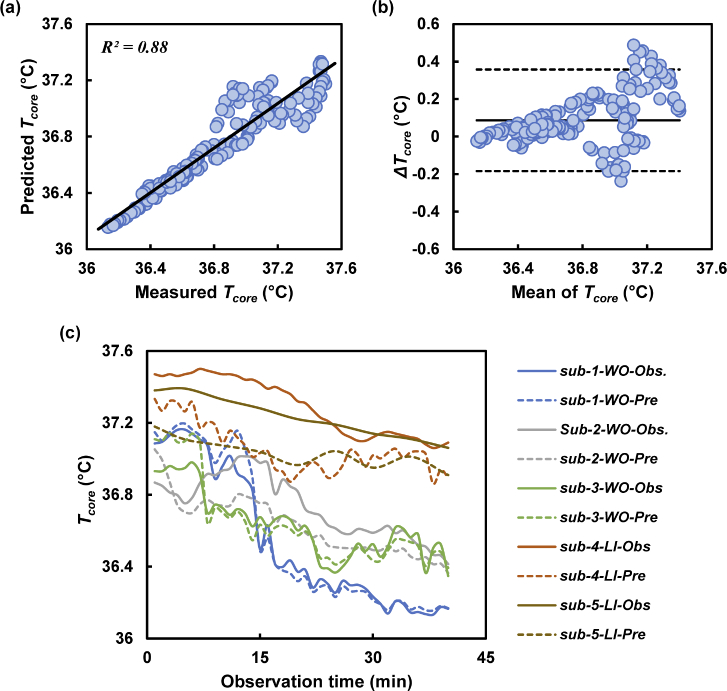
Fig. 8.
Prediction model validated using the test data. (a) Good linearity (R2 = 0.88) shown with the test sets of data for predicting Tcore. (b) The error was measured within an acceptable range. (c) Time course of Tcore measurement plotted to observe similar trends between the measured (solid line) and predicted (dotted line) values.

