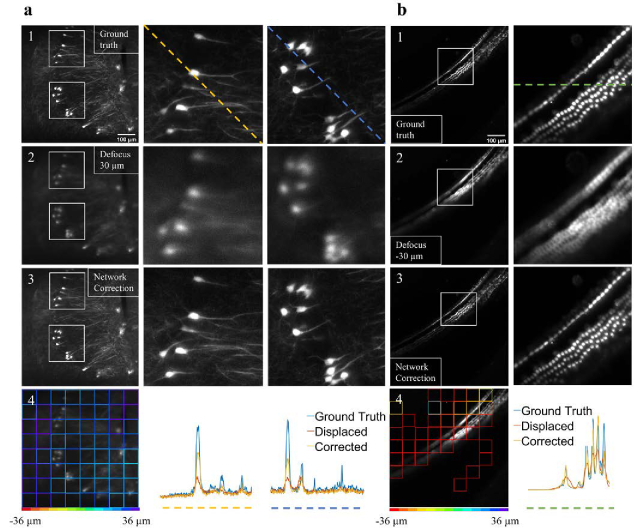
Fig. 5.
Real-time perturbation experiments in light-sheet fluorescence microscopy. (a1 and b1) The in-focus images of neurons and hair cells, respectively. (a2 and b2) Images that show the same field of view as in a1 and b1 after the objective lens is displaced by 30 µm and −30 µm, respectively. (a3 and b3) Images of the same field of view after the objective is moved according to the network defocus evaluation as shown in a4 and b4. The improved image quality in a3 and b3 indicates that the network can estimate the defocus level and adjust the detection focal plane to improve image quality. In a and b, the white boxes mark the location of the zoom-in images, and the color-coded line profiles in a4 and b4 represent image intensities along the dashed lines in a and b.

