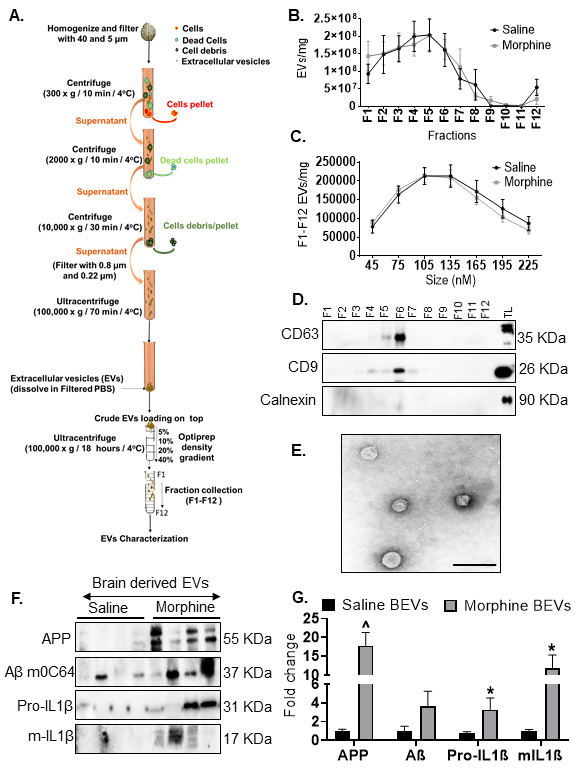
Figure 10.

Characterization of EVs from macaque brain. (A) Schematic representation of isolation protocol for EVs from brain of macaques. (B) Quantification of EVs per mg brain tissue from different fractions (F1-F12) assessed by ZetaView. (C) Size distribution of EVs for the size range 45-225 nm (F1-F12) assessed by ZetaView. (D) Representative western blot images showing EV specific markers (CD63, CD9) in different fractions (F1-F12). (E) Topographic profiling of F4-F7 EVs using transmission electron microscopy (TM) under tapping mode revealed a heterogeneous population of spherical particles. (F, G) Representative western blot images and quantification (normalization with proteins in the EVs) for APP, AβmoC64, Pro-IL1β, m-IL-1β in brain derived EVs (F4-7) from saline or morphine-dependent macaques. *P< 0.05, ^P< 0.01 versus saline. Abbreviations: Aβ- amyloid beta, EVs- extracellular vesicles, IL- interleukin.
