Figure 2.

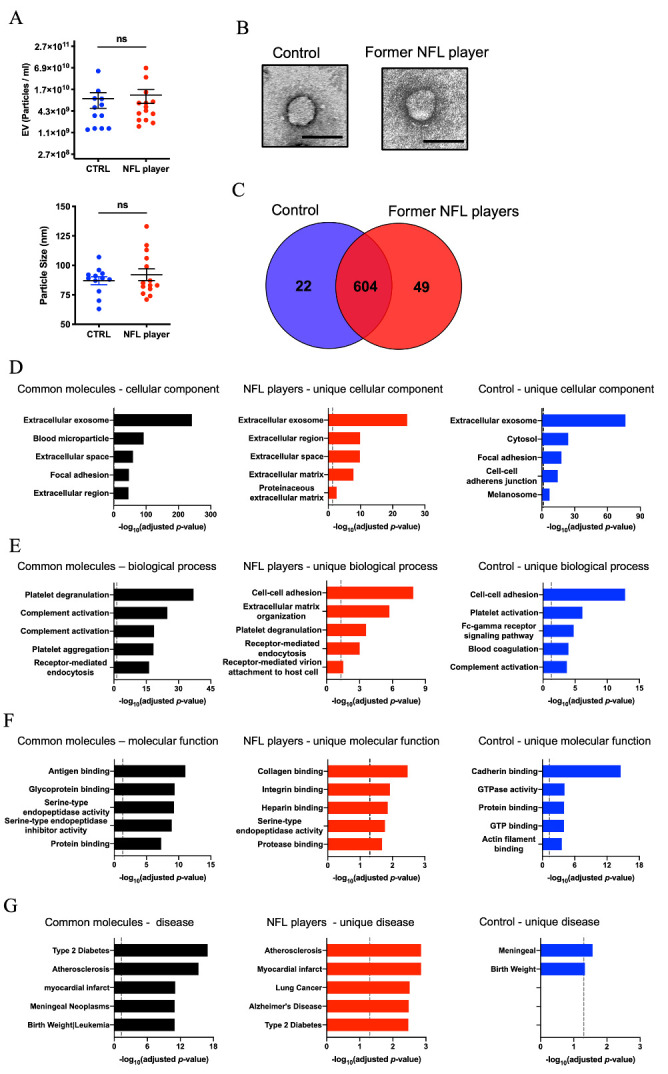
Proteomic profiling of former NFL players and controls plasma-derived EVs. (A) Upper panel: Particle numbers of Plasma-derived EV fraction from CTRLs and former NFL players by NTA (p = 0.4855 by Mann-Whitney test). Y-axis, log2 scale. Lower panel: Particle size of Plasma-derived EV fraction (p = 0.9497). (B) Transmission electron microscopy (TEM) image of former NFL player and control plasma-derived EV. Left: Control, Right: former NFL player. Scale bar; 100nm. (C) Venn diagram of the proteins identified in plasma-derived EVs from CTRLs (blue) and former NFL players (red). (D-G) Gene Ontology (GO) analysis using DAVID Bioinformatics Resources 6.8. (D) The GO term of Top 5 Cellular Component with -log10(FDR p-value). (E) The GO term of Top 5 Biological Process with -log10(FDR p-value). (F) The GO term of Top 5 Molecular Function with -log10(FDR p-value). (G) The GO term of Top 5 Disease Ontology with -log10(FDR p-value).
