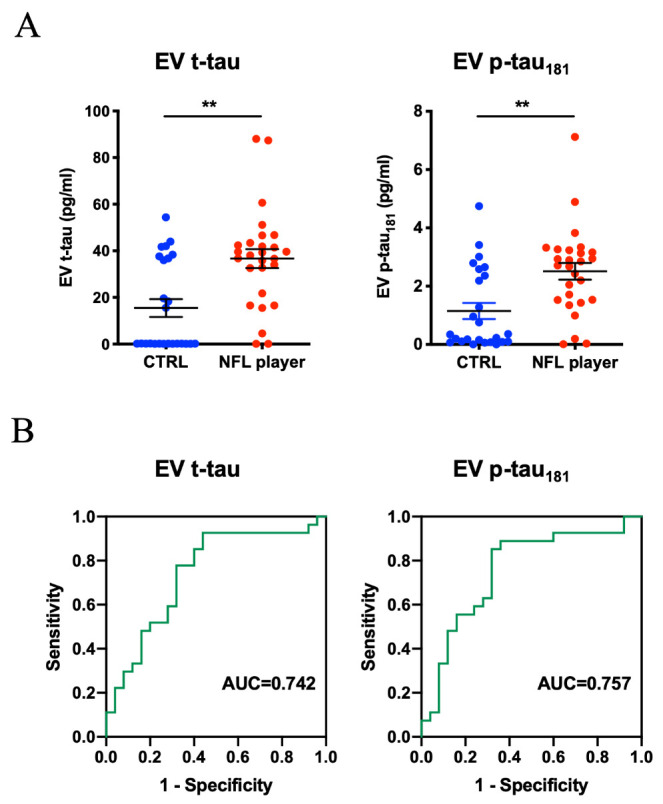
Figure 4.

Levels of Plasma-derived EV t-tau and p-tau from former NFL players and controls. (A) Total-tau and tau phosphorylated at threonine 181 (p-tau181) levels in Plasma-derived EVs in the other cohort (former NFL players = 27, CTRL = 25) by ultrasensitive immunoassay. Left: EV t-tau levels (p = 0.0022). Right: EV p-tau181 levels (p = 0.0011). (B) The ROC curves of EV t-tau and p-tau181. Left: EV t-tau ROC curve (AUC = 0.742). Right: EV p-tau181 ROC (AUC = 0.757).
