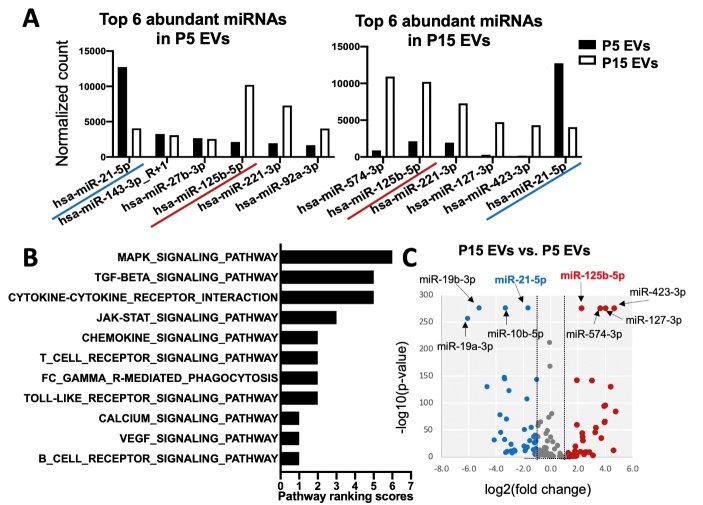
Figure 5.
Comparison of miRNA profiles of EVs from early- and late-passage iMSCs. (A) Top 6 abundant miRNAs in P5 and P15 iMSC-EVs. (B) KEGG immune-mediated pathway ranking of predicted targets of the top 6 ranked miRNAs in EVs from early-passage iMSCs. (C) Volcano plot of the differentially expressed miRNAs in P15 EVs vs P5 EVs. The y-axis indicates the-log 10 of the P-values and the x-axis is the fold change (FC) (measured as the log2 transformed ratio of the expression between two groups).

