Figure 1.
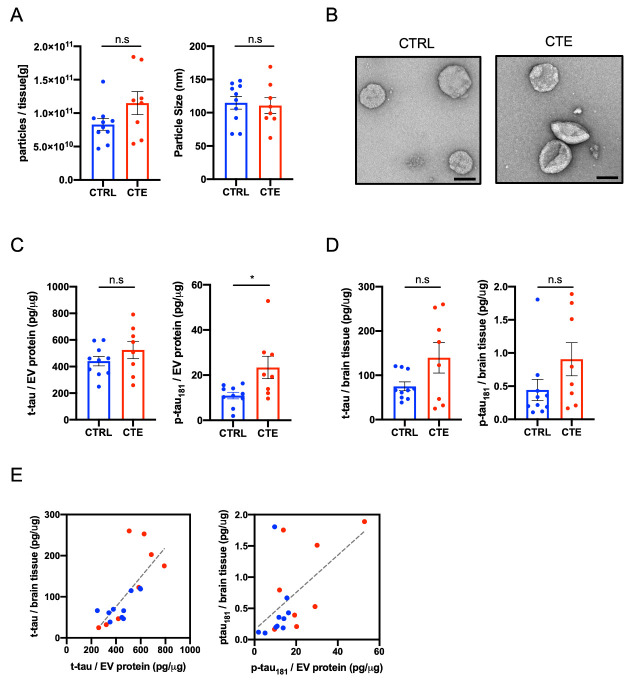
Biochemical characteristic of brain-derived EVs separated from CTE brain tissue. (A) Left: Particle numbers of brain-derived EV fraction from CTRL and CTE by Nanoparticle tracking analysis (p = 0.1522 by Mann-Whitney test). Right: Particle size of brain-derived EV fraction (p = 0.6480). (B) Transmission electron microscopy (TEM) image of CTRL and CTE brain-derived EV fraction. Left: CTRL, Right: CTE. Scale bar; 100nm. (C) T-tau and tau phosphorylated at threonine 181 (p-tau181) levels in CTRL and CTE brain-derived EVs by ELISA. Left: brain-derived EV t-tau (p = 0.3599). Right: brain-derived EV p-tau181 (p = 0.0266). (D) T-tau and p-tau181levels in CTRL and CTE brain tissue homogenates by ELISA. Left: brain tissue homogenates t-tau (p = 0.3154). Right: brain tissue homogenates p-tau181 (p = 0.1220). (E) Scattered plot of brain-derived EV and brain tissue homogenates. Left: t-tau (r = 0.7283, p = 0.0006 using two-tailed t-test), Right: (r = 0.5449, p = 0.0194).

