Figure 2.
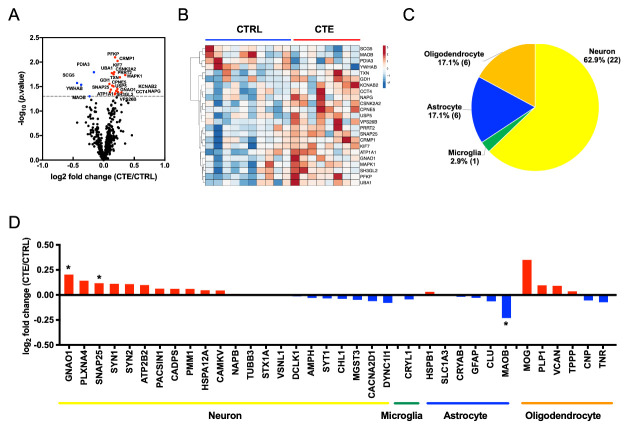
Proteome profiling of CTE and control brain-derived EV. (A) Volcano plot showing degree of differential expression of brain-derived EV proteins in CTE compared with CTRLs. The x-axis indicates log2 transformed fold change in expression. The y-axis shows -log10 transformed p-values. The grey dot line shows the 1.3010 -log10(p-value) cutoff. (B) Heatmap of 23 proteins with the 1.3010 -log10(p-value) cutoff. The value shows log2(fold change). (C-D) Cell type-specific proteins comparison of CTE and CTRL brain-derived EV. (C) Enrichment of brain cell type-specific markers in brain-derived EV proteins. Yellow: Neuron, Green: Microglia, Blue: Astrocytes, Orange: Oligodendrocytes. The parentheses show the number of identified cell type-specific proteins. (D) Comparison of the cell type-specific protein in CTE-derived EVs and CTRL EVs. The red bar shows higher expression in CTE compared with CTRL and Blue bar indicates higher expression in CTRL compared with CTE. The asterisk shows molecules with significantly difference. *p < 0.05 as determined by Student’t t-test.

