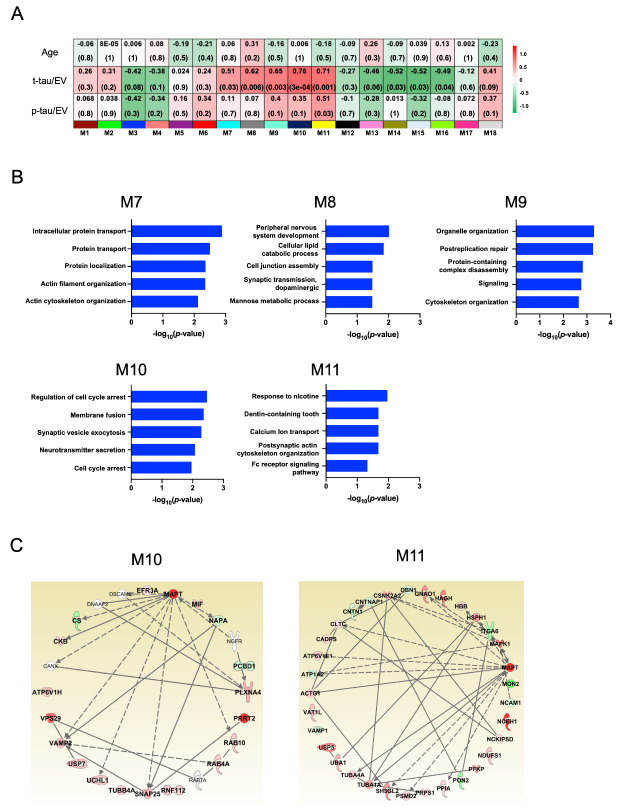
Figure 3.
Protein co-expression Network and differential abundance by t-tau and p-tau in CTE brain EVs. Weighted Protein Correlational Network Analysis (WPCNA) was analyzed on eight CTE and ten control. (A) The Heatmap show the correlation of t-tau and p-tau. The red color indicates positive correlation, and the green shows negative correlation. (B) Two module which indicated significant correlation with t-tau and p-tau were analyzed Cellular component, Molecular Function, and Biological Process by GO analysis. (C) The protein Network analysis was performed two module and tau by IPA-based. The intensity of the node color shows the degree of up-regulation (red) or down- regulation (green).

