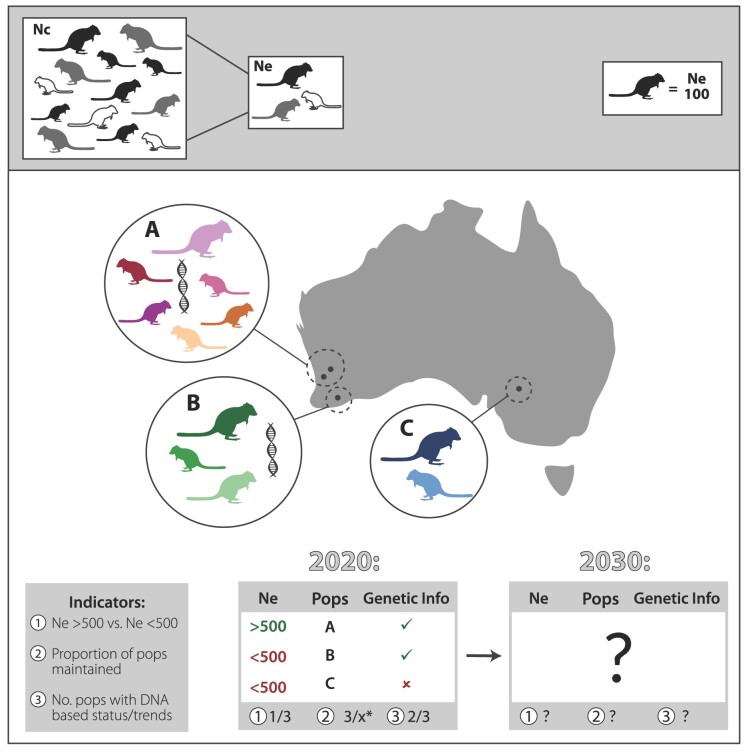
Figure 2.
Hypothetical example demonstrating how indicators can be used to establish baseline and current levels of genetic diversity, and monitor this into the future to guide management decisions. Indicators 1 and 2 can be based on genetic data (effective population size [Ne] and genetically defined populations), or proxies (10% of census size [Nc] or geographic location). The top bar reminds the reader that Ne is much smaller than Nc and shows that each organism in the map represents an Ne of 100. *x is the historical baseline number of populations.

