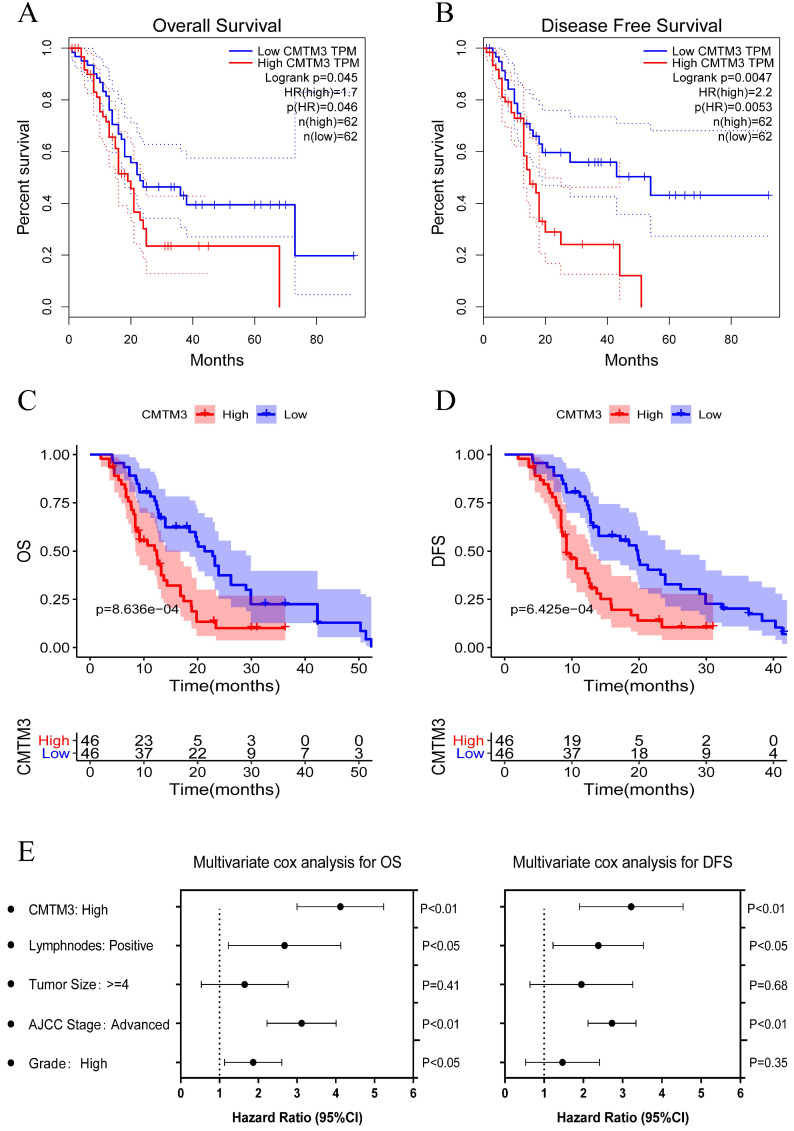
Figure 3.
Kaplan-Meier analyses for overall survival (OS) and disease-free survival (DFS) were performed between the high and low CMTM3 expression groups with a median cut-off. (A-B) The high expression group was associated with poorer OS (p=0.031) and DFS (p=0.0047) in the TCGA cohort. (C-D) The high expression group was associated with poorer OS (p=8.636e-04) and DFS (p=6.425e-04) in the GPPH cohort. (E) Multivariate cox regression analysis showed CMTM3 overexpression was the independent prognostic indicator for OS and DFS in patients with PC.

